12 Superposition

Harmonics of Open and Closed Pipes

The following GeoGebra interactives demonstrate the first few harmonics of an open pipe and a closed pipe given a fixed velocity of sound (340m/s). The frequencies and wavelengths are auto-calculated. Length of the pipe can be varied. Feel free to use, copy or edit them.

Open Pipe

Source: https://www.geogebra.org/m/tsufws72

For embedding into SLS or other websites:

<iframe scrolling="no" title="Harmonics of Open Pipes" src="https://www.geogebra.org/material/iframe/id/tmeypwgx/width/700/height/500/border/888888/sfsb/true/smb/false/stb/false/stbh/false/ai/false/asb/false/sri/false/rc/false/ld/false/sdz/false/ctl/false" width="700px" height="500px" style="border:0px;"> </iframe>
Closed Pipe

Source: https://www.geogebra.org/m/m3p7hny5

For embedding into SLS or other websites:

<iframe scrolling="no" title="Harmonics for Closed Pipe" src="https://www.geogebra.org/material/iframe/id/gm9k6hkg/width/700/height/500/border/888888/sfsb/true/smb/false/stb/false/stbh/false/ai/false/asb/false/sri/false/rc/false/ld/false/sdz/false/ctl/false" width="700px" height="500px" style="border:0px;"> </iframe>

Pressure Nodes and Antinodes

Access in full screen here: https://www.geogebra.org/m/xbknrstt

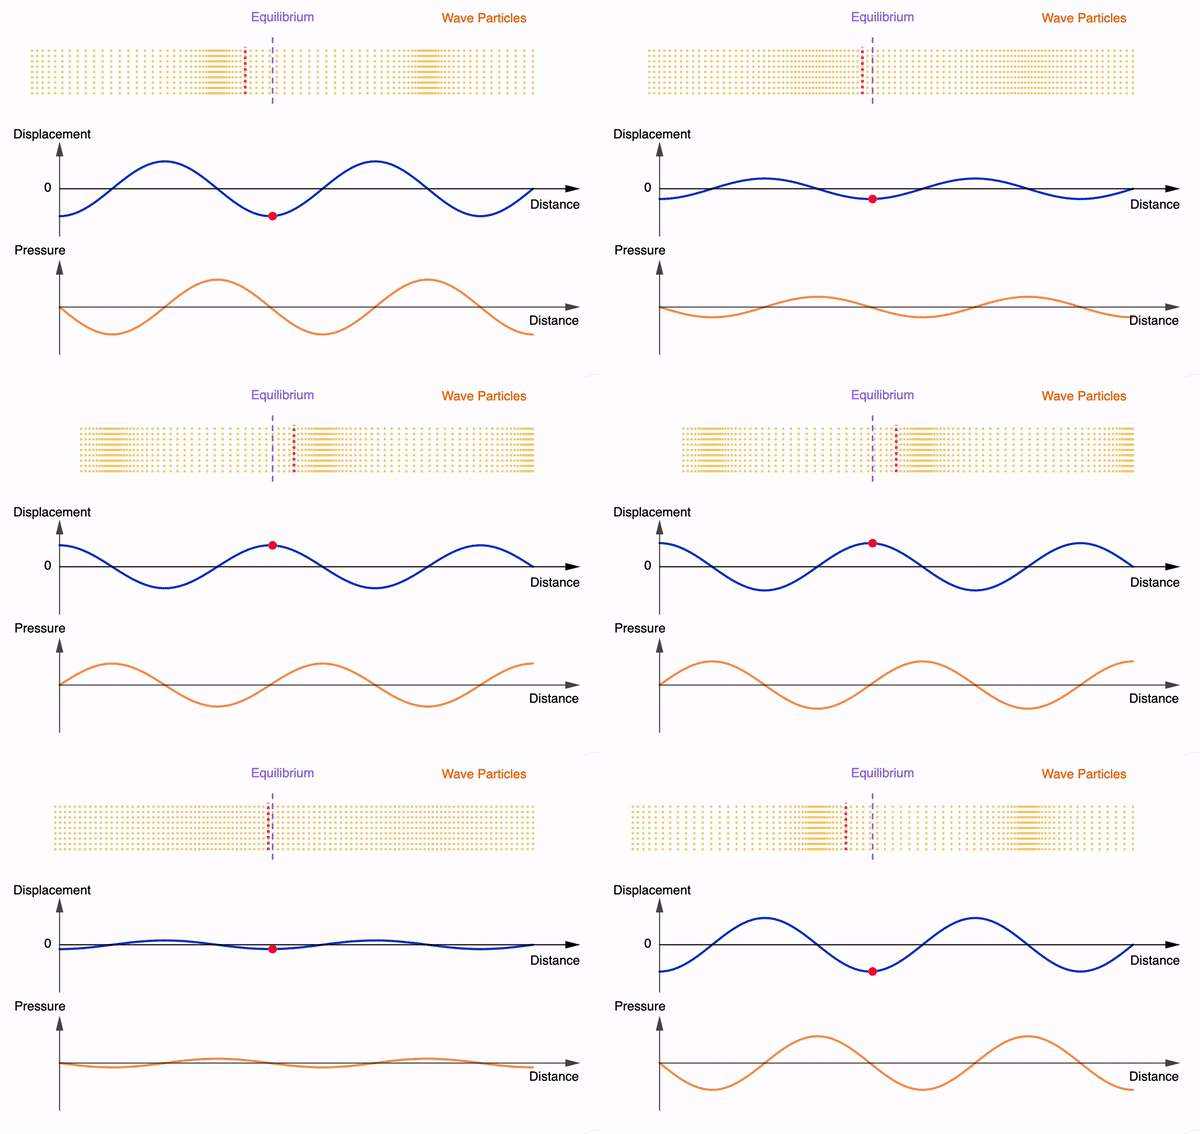
I modified the progressive sound wave interactive into a stationary wave version.

This allows students to visualise the movement of particles about a displacement node to understand why pressure antinodes are found there.

Usually I will pose this question to students: where would a microphone pick up the loudest sound in a stationary sound wave? Invariantly, students will say it is at the antinode. When asked to clarify if it is the displacement antinode or pressure antinode, students then become uncertain.

According to Young & Geller (2007), College Physics 8th Edition, Pearson Education Inc. (pg 385), microphones and similar devices usually sense pressure variations and not displacements. In other words, the position within a stationary sound wave at which the loudest sound is picked up is at the displacement nodes which are the pressure antinodes.

For an alternative animation, check out Daniel Russell’s.

For embedding into SLS, please use the following code:

<iframe scrolling="no" title="Stationary Sound Wave (Displacement and Pressure)" src="https://www.geogebra.org/material/iframe/id/xbknrstt/width/640/height/480/border/888888/sfsb/true/smb/false/stb/false/stbh/false/ai/false/asb/false/sri/false/rc/false/ld/false/sdz/true/ctl/false" width="640px" height="480px" style="border:0px;"> </iframe>
This animation gif file demonstrates the movement of particles in a stationary sound wave, displaying the changing displacement-distance and pressure-distance graphs simultaneously. It can be inserted into slides and websites. Free to use!

Noise-cancelling AirPod Pro

The recently launched Apple AirPod Pro presents a wonderful opportunity to relate an A-level concept to a real-world example – how noise-cancelling earphones work.

Apple’s website explained it in layman terms that seem to make sense. Let your students attempt to do a better job of explaining how destructive interference of waves is applied.

I probably won’t spend SGD379 on it though.

Phase Difference GeoGebra Apps

I created a series of GeoGebra apps for the JC topics of Waves and Superposition, mainly on the concept of Phase Difference. The sizes of these GeoGebra apps are optimised for embedding into SLS. When I have time, I will create detailed instructions on how to create such apps. Meanwhile, feel free to use them.

Instructions on how to embed the apps into SLS can be found in the SLS user guide.

Phase difference between two particles on a progressive wave. Move the particles along the wave to see the value.

Phase difference between two particles on a stationary wave. Move the particles along the wave to observe how their velocities are different or similar.

Observe velocity vectors of multiple particles on a progressive wave.

Microwave Standing Waves

In the last tutorial, we were talking about the typical wavelength of different categories of electromagnetic waves. To help us remember the typical wavelength of microwaves, I suggest that we familiarise ourselves with a popular science experiment involving stationary microwaves in an oven.

Watch the following video from 2 min 20 sec to see how the experiment is conducted and how the wavelength of microwave can be measured after determining the distance between two adjacent nodes (the wavelength will be twice that distance). Therefore, the typical wavelength of microwaves will be of the order of magnitude of several centimetres.