A recent trending phenomenon on the internet is the audio recording of a word, which is interpreted different by two groups of people – those who hear it as “Laurel” vs those who hear “Yanny”.
To find out which camp you are on, right-click to download this mp3 file and or listen by clicking the “play” button below!
Personally, I hear it as “Laurel” and it has got to do with the fact that the audible frequencies of my ears are pretty limited, thanks in part to my age. For an explanation, watch this video:
Now that you have found out why this recording could potentially “divide a nation”, it is worth considering it as part of an activity to pique students’ interest and activate learning. Students can be prompted to rely on their prior knowledge and experience to generate questions using a thinking routine such as “Claim-Support-Question“.
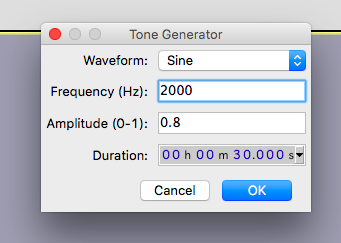
As an activity to promote thinking and discussion, students can be asked to test if the claim made by this video is true. They can conduct experiments to test their own audible frequencies using audio recording and generating software such as Audacity which is open source and easy to use. With the whole class participating, there should be enough data to figure out if there is a pattern between the frequencies that the “Yanny” camp can hear that the “Laurel” camp can’t and vice versa.

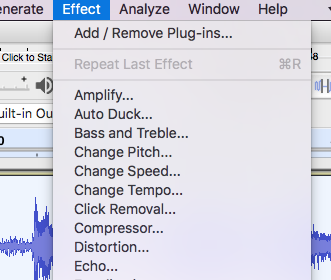
Alternatively, you can choose to change the pitch of the recording using the “Change Pitch” effect of the Audacity software. Through this activity, students can directly observe how a change in frequency can lead to a change in pitch.
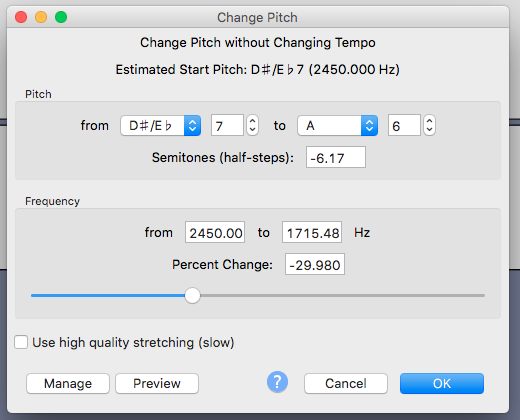
Changing the pitch down by 30% if you are a “Laurel” hearer who wants to listen to what “Yanny” sounds like. Raise the pitch by 30% if you are young enough to hear “Yanny”. If that does not work, play around with other values of pitch change.
Finally, if there is sufficient time that can be devoted to this topic, students can be asked to make a presentation on the relationship between frequency and pitch, and demonstrate that they can apply what they have learnt to other real-life applications such as ultrasound and music.
