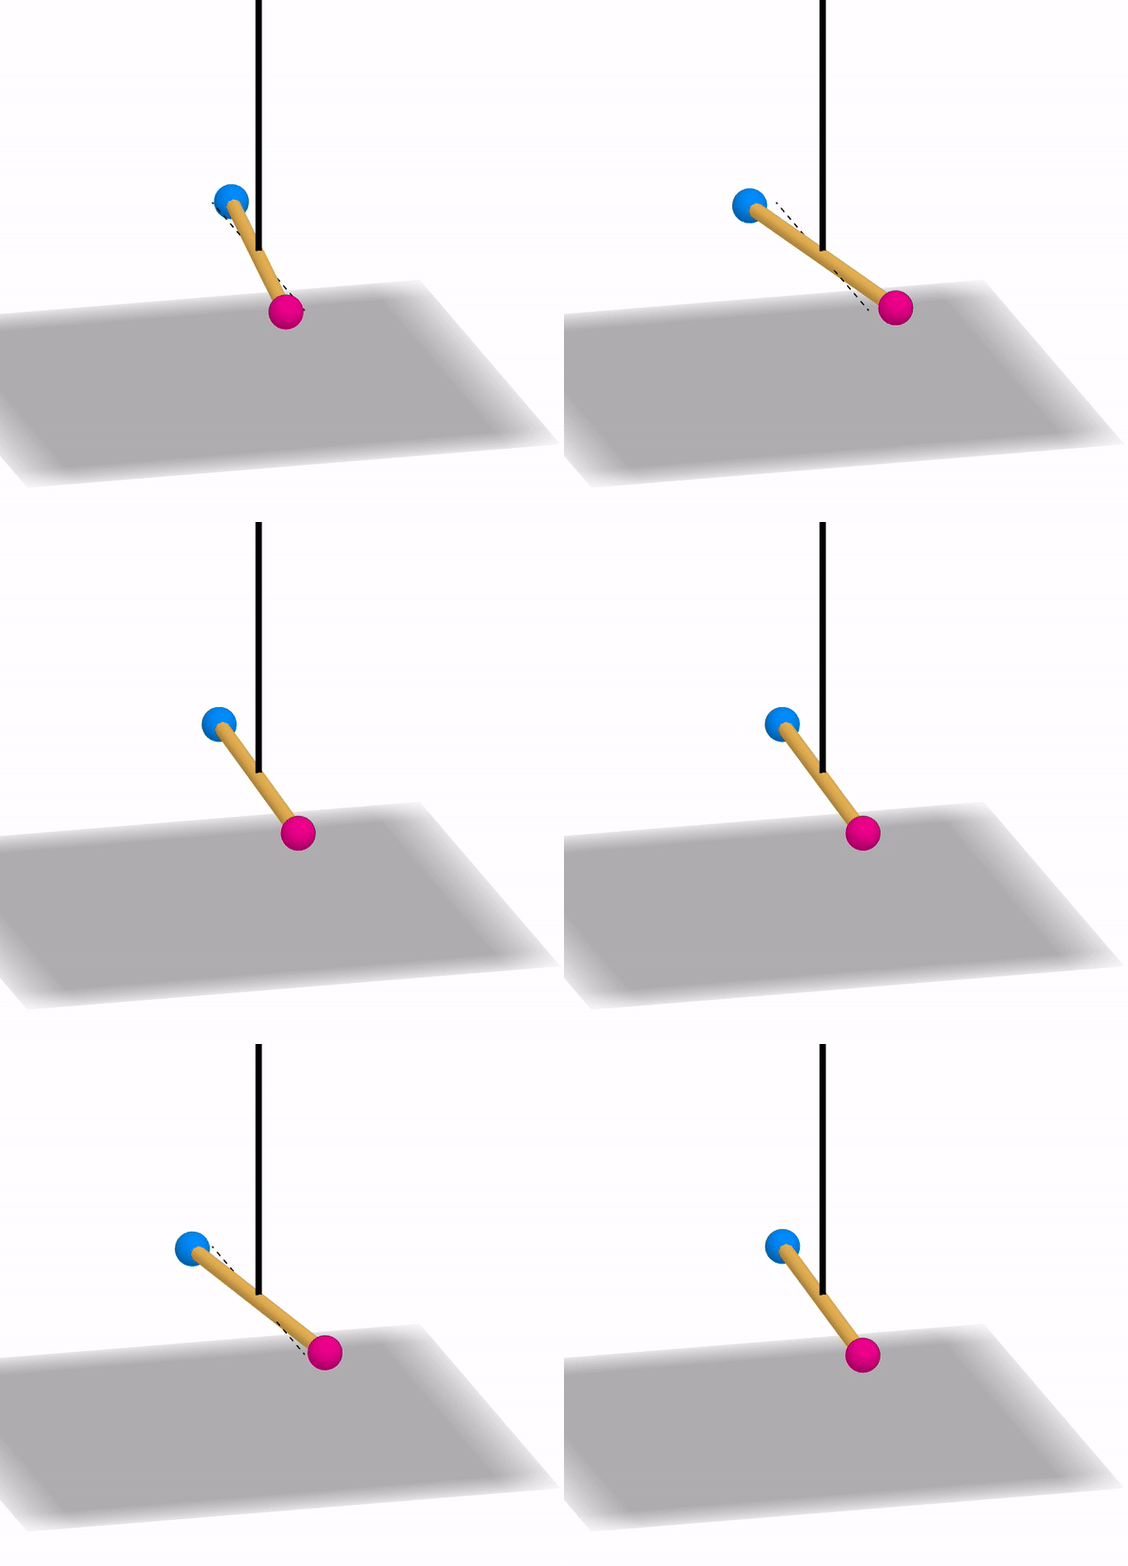
In preparation for HBL in 2022, I designed a simple virtual experiment that will allow for students to collect data on oscillations using their own stopwatches and investigate the relationship between the period of oscillation and two separate variables. To access the simulation on GeoGebra, visit https://www.geogebra.org/m/jhc4xvpe.
Based on the given relationship $$T = cm^aL^b$$ where a, b and c are constants, students will be tasked to find the constants a, b and c. Students will then attempt to “linearise” the equation such that the independent variables m and L can be tested one by one.
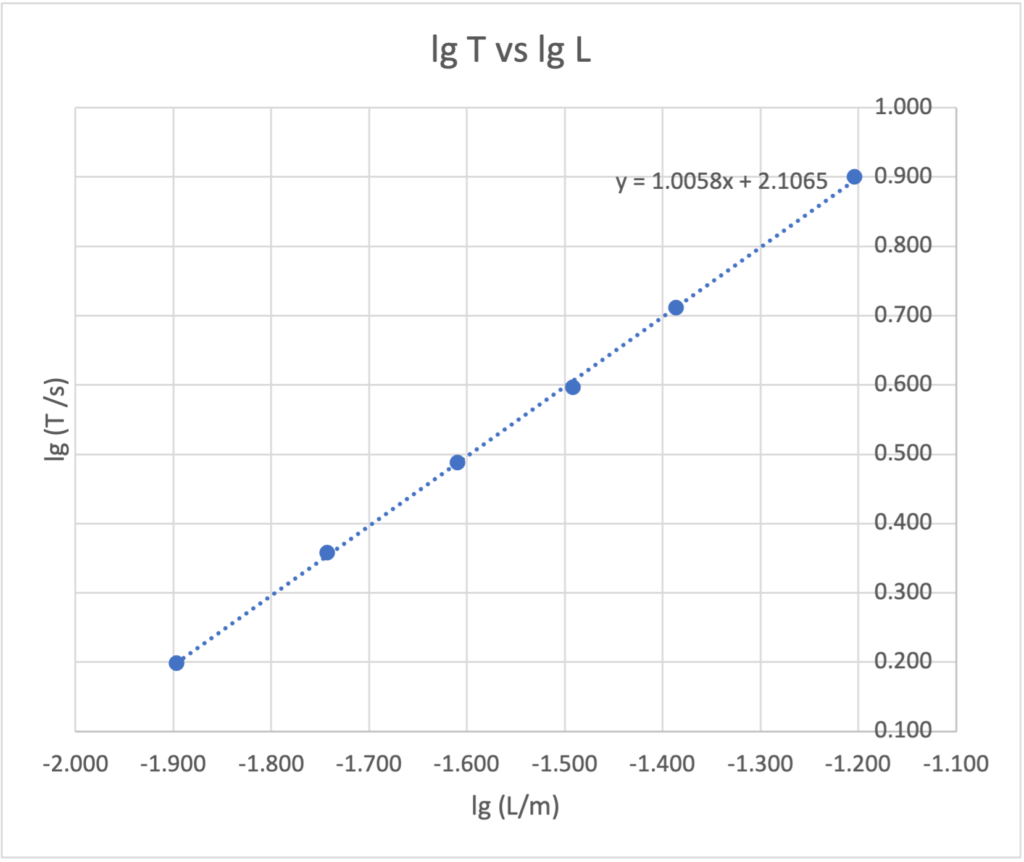
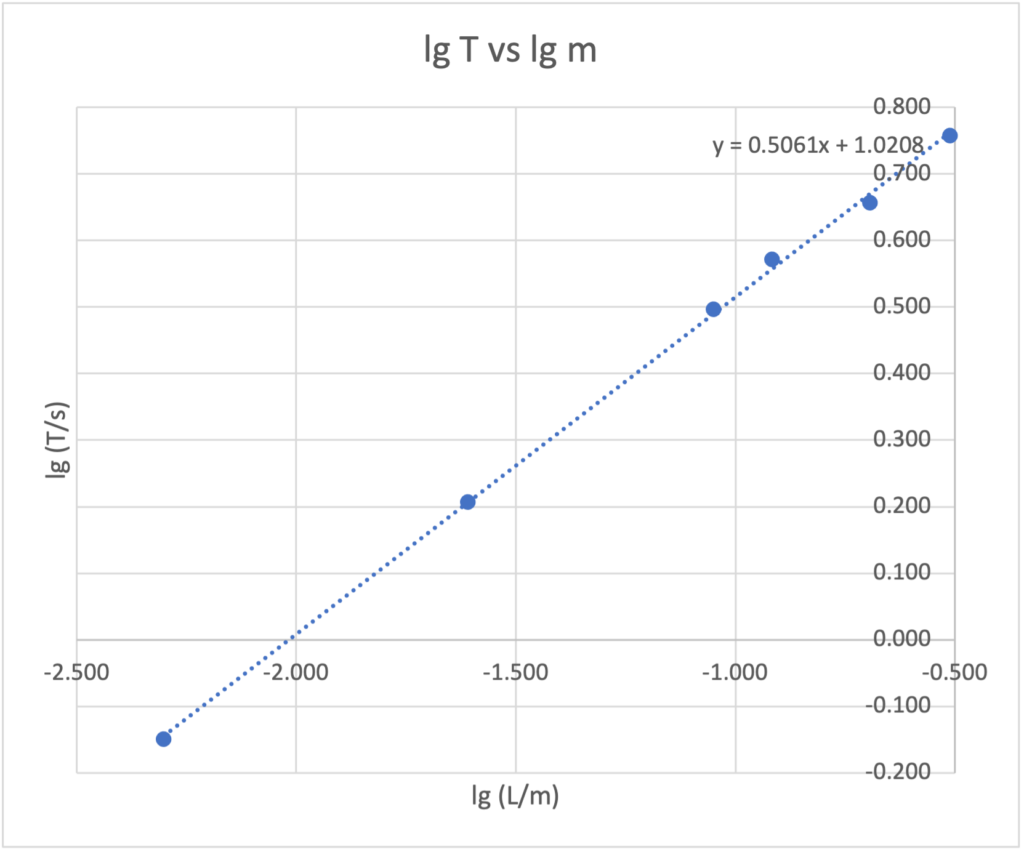
Examples of data collected can be plotted using Excel to give the following graphs from which the gradients and vertical intercepts can be obtained instantly.


