O-level Topics

Radioactive Decay Simulation Created Using ChatGPT 4o


This simulation of radioactive decay was created using ChatGPT4o.

The prompts used are:

  • Create a javascript simulation with a html5 canvas. Show all the codes in one page.
  • Start with grey particles in a 60 by 60 arrangement. Represent the particles using small circles.
  • Upon clicking the start animation button, every second, a number of grey particles will turn red. Randomly select the particles to decay. Assume the half-life to be one second initially. Allow the user to change the half life from one to 200 seconds. The particles that have turned red must remain red.
  • Use plotly.js to create a decay graph. The horizontal axis is time and vertical axis is number of undecayed nuclei.
  • Initialise the graph such that the time axis starts at zero and the vertical axis shows 3600 at first.
  • Refresh the particles and the graph every second.
  • Display the numerical value of time and number of undecayed particles in text as well.
  • Add a button to download the data in csv format.

Radioactive decay is a fundamental process in nuclear physics where unstable atomic nuclei lose energy by emitting radiation. This decay occurs randomly for individual atoms, but when observed in a large sample, it follows a predictable statistical pattern described by the half-life, which is the time required for half of the radioactive nuclei in a sample to decay. The half-life is a constant characteristic of each radioactive isotope and is not affected by physical conditions such as temperature or pressure.

The probability of decay for each nucleus per unit time is constant, leading to an exponential decay law. Mathematically, if $N_O$​ is the initial number of undecayed nuclei, the number remaining at time 𝑡t can be described by $N(t) = N_0 \dot (0.5)^{t/T_{1/2}}$, where $T_{1/2}$​ is the half-life. This exponential relationship explains why, after each half-life, half of the remaining radioactive atoms will have decayed. As a result, the decay process continues until all the radioactive material has transformed into stable isotopes.

In our simulation, we model this stochastic process by randomly determining whether each nucleus decays based on the given half-life. Each second, a fraction of the remaining grey particles (representing undecayed nuclei) turn red (representing decayed nuclei), mimicking the random yet statistically predictable nature of radioactive decay. The simulation and accompanying graph provide a visual and quantitative representation of how radioactive substances diminish over time, illustrating the principles of exponential decay and the role of half-life in nuclear physics.

Pythagorean Cup

This is a 3D printed Pythagorean cup, otherwise known as a greedy cup, where if one pours far too much water or wine or whatever your greedy heart desires, all the contents in the cup will leak out through the bottom.

This is based on the design by “jsteuben” on Thingiverse (https://www.thingiverse.com/thing:123252). The siphoning effect kicks in when the water level is above the internal “tube” printed and hidden into the walls of the cup.

I printed another cup based on a more conventional design as well, but due to the wrong settings given when I prepared the gcode file, the cup was rather leaky when the water level was low. This design by “MonzaMakers” has a protruding siphon tube. (https://www.thingiverse.com/thing:562790)

Explaining how the siphon works is easier with the second cup. When the water level is lower than the highest point in the siphoning tube, it remains in the cup. When it exceeds the highest point of the tube, water begins to flow down the part of the tube leading to the opening at the bottom of the cup. The falling water column creates a suction effect and continuously draws the rest of the water in, until the cup is dry.

Magdeburg Hemispheres

As promised, I am sharing another purchase made during this mid-term break for my kids.

Magdeburg hemispheres are used to demonstrate the power of atmospheric pressure. This simple demonstration kit consists of two plastic hemispheres, a rubber ring, a one-way valve, a syringe and some rubber tubing.

First, the one-way valve and the syringe are attached to the hemisphere that has a nozzle.

The two hemispheres are then placed together with the rubber ring between them. The rubber ring will serve as a seal as the hemispheres press against it when the air is pumped out.

As the syringe is pulled, the pressure inside the sphere decreases. This results in the atmospheric pressure being significantly larger than the internal pressure and thus, the hemispheres can not be pulled apart by hand.

To separate the hemispheres, remove the tubing and the hemispheres will simply fall apart as the internal pressure rises and reaches an equilibrium with atmospheric pressure.

The kit can be bought for less than S$3 here. There are other sellers that seem to offer lower prices, which I realised while doing a search for the keywords “Magdeburg Hemispheres” only after making the purchase because I was thinking it could not get any lower.

Does Hydrostatic Pressure Depend on Container Shape?

The following GeoGebra app simulates a pressure sensor that measures hydrostatic pressure, calibrated to eliminate the value of atmospheric pressure.

The purpose of this simulation is to address certain misconceptions by students such as the assumption that the shape of a container affects the pressure such that the pressure differs in different containers when measured at the same depth.

Drag the dot around to compare the pressure values at the same height between both containers.

The following codes can be used to embed this into SLS.

<iframe scrolling="no" title="Hydrostatic Pressure" src="https://www.geogebra.org/material/iframe/id/wbjduxt7/width/640/height/480/border/888888/sfsb/true/smb/false/stb/false/stbh/false/ai/false/asb/false/sri/true/rc/false/ld/false/sdz/false/ctl/false" width="640px" height="480px" style="border:0px;"> </iframe>

An Aural Illusion for Teaching Frequency and Pitch of Sound

A recent trending phenomenon on the internet is the audio recording of a word, which is interpreted different by two groups of people – those who hear it as “Laurel” vs those who hear “Yanny”.

To find out which camp you are on, right-click to download this mp3 file and or listen by clicking the “play” button below!

Personally, I hear it as “Laurel” and it has got to do with the fact that the audible frequencies of my ears are pretty limited, thanks in part to my age. For an explanation, watch this video:

Now that you have found out why this recording could potentially “divide a nation”, it is worth considering it as part of an activity to pique students’ interest and activate learning. Students can be prompted to rely on their prior knowledge and experience to generate questions using a thinking routine such as “Claim-Support-Question“.

As an activity to promote thinking and discussion, students can be asked to test if the claim made by this video is true. They can conduct experiments to test their own audible frequencies using audio recording and generating software such as Audacity which is open source and easy to use. With the whole class participating, there should be enough data to figure out if there is a pattern between the frequencies that the “Yanny” camp can hear that the “Laurel” camp can’t and vice versa.

Generating Tones in Audacity

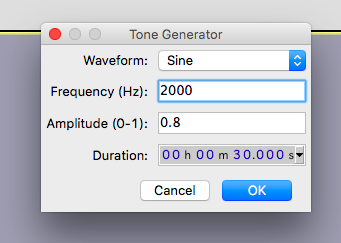
Select a frequency to test if students can hear it, say 10000 Hz.

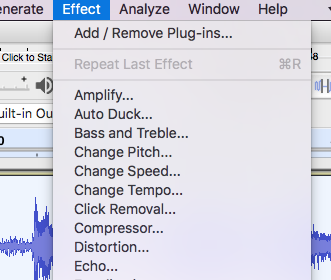
Alternatively, you can choose to change the pitch of the recording using the “Change Pitch” effect of the Audacity software. Through this activity, students can directly observe how a change in frequency can lead to a change in pitch.

Changing pitch with Audacity

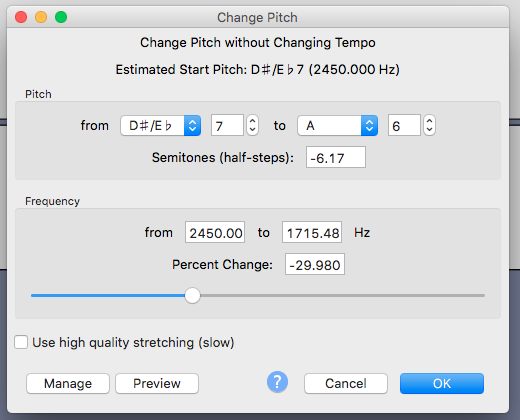
Change the pitch by 30% to hear Yanny

Changing the pitch down by 30% if you are a “Laurel” hearer who wants to listen to what “Yanny” sounds like. Raise the pitch by 30% if you are young enough to hear “Yanny”. If that does not work, play around with other values of pitch change.

Finally, if there is sufficient time that can be devoted to this topic, students can be asked to make a presentation on the relationship between frequency and pitch, and demonstrate that they can apply what they have learnt to other real-life applications such as ultrasound and music.