This is a post that exists simply to park the YouTube videos that I might need to use during a JC2 lecture on Electromagnetism.
As a means of visualising what happens to the potential difference, current and power dissipated in an alternating current circuit with half-wave rectification, I have created the interactive applet with all 3 graphs next to each other.
It should be easy for students to see that with half-wave rectification, the power dissipated is half that of a normal a.c. supply with the same peak p.d. and current.
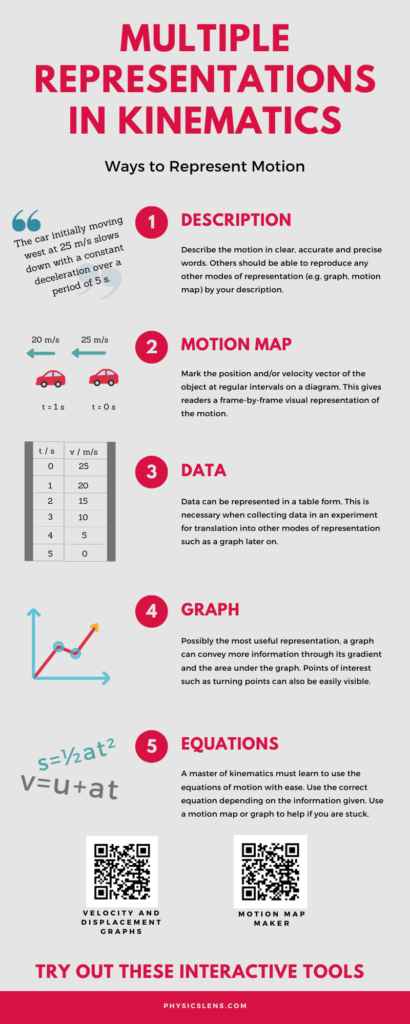
This is another Infographic made using Canva last year.

In preparing for blended learning lessons for my JC2 students, I tweaked the Gravitational Potential applet made last year for a similar display of the electric potential between two point charges. This is a testament to the similarities between the two concepts as well as the ease of adapting a GeoGebra applet for education.
We can scaffold students’ learning using this interactive applet by asking questions such as:
- By observing the electric potential graph, are you able to find a point when the net field / force acting on a test charge is zero? What are the necessary conditions?
- The slope of the sum of the electric potentials is analogous to that of a physical slope where a ball will roll downhill in the same way that a positive test charge will accelerate based on the potential gradient. However, this analogy will work differently for a test charge that is negative. Why?
- Given that
To paste this applet into SLS, use the following embed code. In SLS, create a new component within an Activity within a Lesson using the “+” button. Choose Text/Media and select the button that shows “</>” or reads Embed Website/App”. Copy and paste the following codes to the box.
<iframe scrolling="no" title="Electric Potential of Two Point Charges" src="https://www.geogebra.org/material/iframe/id/z8cr66wb/width/640/height/480/border/888888/sfsb/true/smb/false/stb/false/stbh/false/ai/false/asb/false/sri/false/rc/false/ld/false/sdz/true/ctl/false" width="640px" height="480px" style="border:0px;"> </iframe>By embedding the gravitational potential distance graph for two masses, a comparison can be made between the two. This will help students draw connections between the two concepts based on the fact that the forces both follow an inverse-square law.
This is the embed code for the applet on gravitational potential.<iframe scrolling="no" title="Gravitational Potential between Two Planets" src="https://www.geogebra.org/material/iframe/id/ff55x6vr/width/638/height/478/border/888888/sfsb/true/smb/false/stb/false/stbh/false/ai/false/asb/false/sri/true/rc/false/ld/false/sdz/false/ctl/false" width="638px" height="478px" style="border:0px;"> </iframe>The concept of root-mean-square values for Alternating Currents is challenging if students are to relate the I-t graph with the Irms value directly.
They have to be brought through the 3 steps before arriving at the Irms value. This interactive applet allows them to go through step by step and compare several graphs at one time to see the relationship.
Through the interaction, students might be asked to observe that the Irms value is never higher than the peak Io.
For a complete sinusoidal current:
For a diode-rectified current:
In comparing the Irms of both currents, students can be asked to consider why the ratio of the values is not 2:1 or any other value, from energy considerations.
Worked on this earlier as I am the lead lecturer for this JC2 topic and am trying to integrate useful elements of blended learning. Do let me know in the comments if you have ideas or feedback that you would like to share.
This pendulum-powered car is constructed using Lego Technic parts. I used mainly Lego beams to create the chassis and an “A” frame from which the pendulum is suspended. The pendulum is made of Lego beams and some wheels.
When the pendulum swings, it experiences an acceleration towards its equilibrium position. By the principle of conservation of momentum, the car experiences a change in momentum in the opposite direction. Since the acceleration of the pendulum changes its direction every half a cycle of its oscillation, the car will only oscillate about its original position if the wheels of the car are free to turn throughout the oscillation.
A escapement mechanism which consists of a beam resting on a pair of 40-tooth gears attached to the front wheels prevent the wheels from rotating in the opposite direction. This means that the car will only be moving forward during the half of the pendulum’s oscillation when its displacement is at the front of its equilibrium position and pauses during the other half.