IP4 19 Nuclear Physics

Geiger–Müller counter simulation

A Geiger-Muller (GM) counter is an instrument for detecting and measuring ionizing radiation. It operates by using a Geiger-Muller tube filled with gas, which becomes ionized when radiation passes through it. This ionization produces an electrical pulse that is counted and displayed, allowing users to determine the presence and intensity of radiation.
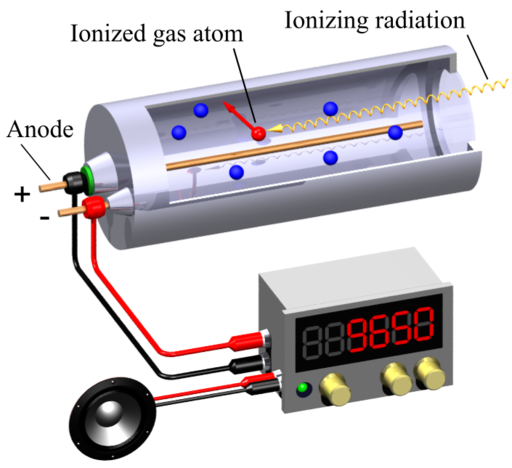
Svjo-2, CC BY-SA 3.0, via Wikimedia Commons

This simulation (find it at https://physicstjc.github.io/sls/gm-counter) allows students to explore the random nature of radiation and the significance of accounting for background radiation in experiments. Here’s a guide to help students investigate these concepts using the simulation.

Exploring Background Radiation

Q1: Set the source to “Background” and start the count. Observe the count for a few minutes. What do you notice about the counts recorded?

A1: The counts recorded are relatively low and vary randomly. This reflects the background radiation which is always present.


Q2: Why is it important to measure background radiation before testing other sources?

A2: Measuring background radiation is important to establish a baseline level of radiation. This helps in accurately identifying and quantifying the additional radiation from other sources.


Investigating a Banana as a Radiation Source

Q3: Change the source to “Banana” and reset the data. Start the count and observe the readings. How do the counts from the banana compare to the background radiation?

A3: The counts from the banana are higher than the background radiation. This is because bananas contain a small amount of radioactive potassium-40.


Q4: How do the counts per minute (CPM) for the banana vary over time? Is there a pattern or do the counts appear random?

A4: The counts per minute for the banana vary over time and appear random, reflecting the stochastic nature of radioactive decay.


Exploring a Cesium-137 Source

Q5: Set the source to “Cesium-137” and reset the data. Start the count and observe the readings. How do the counts from Cesium-137 compare to both the background radiation and the banana?

A5: The counts from Cesium-137 are significantly higher than both the background radiation and the banana. This is because Cesium-137 is a much stronger radioactive source.


Q6: What do the counts per minute (CPM) tell you about the intensity of the Cesium-137 source compared to the other sources?

A6: The CPM for Cesium-137 is much higher, indicating a higher intensity of radiation compared to the background and banana sources.


Understanding the Random Nature of Radiation

Q7: By looking at the sample counts, can you predict the next count value? Why or why not?

A7: No, you cannot predict the next count value because radioactive decay is a random process. Each decay event is independent of the previous ones.


Q8: How can you use the background radiation measurement to correct the readings from the banana and Cesium-137 sources?

A8: You can subtract the average background CPM from the CPM of the banana and Cesium-137 sources to get the corrected readings, isolating the radiation from the specific sources.


Radioactive Decay Simulation Created Using ChatGPT 4o


This simulation of radioactive decay was created using ChatGPT4o.

The prompts used are:

  • Create a javascript simulation with a html5 canvas. Show all the codes in one page.
  • Start with grey particles in a 60 by 60 arrangement. Represent the particles using small circles.
  • Upon clicking the start animation button, every second, a number of grey particles will turn red. Randomly select the particles to decay. Assume the half-life to be one second initially. Allow the user to change the half life from one to 200 seconds. The particles that have turned red must remain red.
  • Use plotly.js to create a decay graph. The horizontal axis is time and vertical axis is number of undecayed nuclei.
  • Initialise the graph such that the time axis starts at zero and the vertical axis shows 3600 at first.
  • Refresh the particles and the graph every second.
  • Display the numerical value of time and number of undecayed particles in text as well.
  • Add a button to download the data in csv format.

Radioactive decay is a fundamental process in nuclear physics where unstable atomic nuclei lose energy by emitting radiation. This decay occurs randomly for individual atoms, but when observed in a large sample, it follows a predictable statistical pattern described by the half-life, which is the time required for half of the radioactive nuclei in a sample to decay. The half-life is a constant characteristic of each radioactive isotope and is not affected by physical conditions such as temperature or pressure.

The probability of decay for each nucleus per unit time is constant, leading to an exponential decay law. Mathematically, if $N_O$​ is the initial number of undecayed nuclei, the number remaining at time 𝑡t can be described by $N(t) = N_0 \dot (0.5)^{t/T_{1/2}}$, where $T_{1/2}$​ is the half-life. This exponential relationship explains why, after each half-life, half of the remaining radioactive atoms will have decayed. As a result, the decay process continues until all the radioactive material has transformed into stable isotopes.

In our simulation, we model this stochastic process by randomly determining whether each nucleus decays based on the given half-life. Each second, a fraction of the remaining grey particles (representing undecayed nuclei) turn red (representing decayed nuclei), mimicking the random yet statistically predictable nature of radioactive decay. The simulation and accompanying graph provide a visual and quantitative representation of how radioactive substances diminish over time, illustrating the principles of exponential decay and the role of half-life in nuclear physics.

Thorium as an alternative source of nuclear energy

It’s about time Singapore considered building a liquid fluoride thorium reactor as a safe source of nuclear energy. From the video, it would appear that thorium is safe as it cannot be weaponized, does not require high pressure containers and the risk of a meltdown does not exist. For a small island state like Singapore, this presents an attractive way of obtaining relatively clean abundant energy. I’m sure if we think hard enough we will be able to solve the other problems such as storage of waste products.

Perhaps the part of our syllabus on Nuclear Physics will need to be updated then.