This is the best video I have come across so far that is used to introduce the idea of perpetual motion engines and why it violates the principle of conservation of energy.
This simulation can be used for O-level Physics, for the topic of Pressure. I created it as it was relevant to our school’s IP3 physics as well.
It demonstrates the working principle of a hydraulic press. By adjusting the cross-section areas (A) of the two cylinders, you only need a small amount of force at the narrow piston to exert a large amount of force at the wider piston. This is how, when driving, the force applied by one’s foot is enough to supply a large force to apply the brake pads on a car’s wheels.
The advantage of using GeoGebra is that one can create such simple simulations within a couple of hours and it can be readily embedded into Google Classroom, Microsoft OneNote, SLS – a wonderful tool to have during this period of full home-based learning.
While preparing for a bridging class for those JAE JC1s who did not do pure physics in O-levels, I prepared an app on using a vector triangle to “solve problems for a static point mass under the action of 3 forces for 2-dimensional cases”.
For A-level students, they can be encouraged to use either the sine rule or the cosine rule to solve for magnitudes of forces instead of scale drawing, which is often unreliable.
For students who are not familiar with these rules, here is a simple summary:
Sine Rule
If you are trying to find the length of a side while knowing only two angles and one side, use sine rule:
$$\dfrac{A}{\sin{a}}=\dfrac{B}{\sin{b}}$$
Cosine Rule
If you are trying to find the length of a side while knowing only one angle and two sides, use cosine rule:
$$A^2 = B^2 + C^2 – 2BC\cos{a}$$
Here are the steps to solving a problem involving Newton’s 2nd law.
Step 1: Draw a free body diagram – where possible, sketch a free body diagram to represent:
- the body isolated from other objects
- the forces acting on the body (ignore all internal forces) along the line of motion.
- the direction of acceleration.
Step 2: Write down the equation: $$F_{net}=ma$$
Step 3: Add up the forces on the left-hand side of the equation, making sure that forces acting opposite to the direction of acceleration are subtracted.
Step 4: Solve the equation for the unknown.
For example,
A horizontal force of 12 N is applied to a wooden block of mass 0.60 kg on a rough horizontal surface, and the block accelerates at 4.0 m s-2. What is the magnitude of the frictional force acting on the block?
Step 1: Free-body diagram

Step 2: Write down the 2nd law equation
By Newton’s 2nd law, $$F_{net}=ma$$
Step 3: Add up the forces making up the net force
$$12 – f = 0.60 (4.0)$$
Step 4: Solve for unknown
$$ f = 12 – 2.4 = 9.6 N$$
Students are often confused about the forces in drawing free-body diagrams, especially so when they have to consider the different parts of multiple bodies in motion.
Two-Body Motion
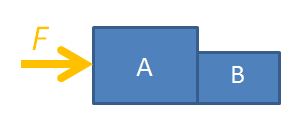
Let’s consider the case of a two-body problem, where, a force F is applied to push two boxes horizontally. If we were to consider the free-body diagram of the two boxes as a single system, we only need to draw it like this.

For the sake of problem solving, there is no need to draw the normal forces or weights since they cancel each other out, so the diagram can look neater. Applying Newton’s 2nd law of motion, $F=(m_A+m_B) \times a$, where $m_A$ is the mass of box A, $m_B$ is the mass of box B, F is the force applied on the system and a is the acceleration of both boxes.
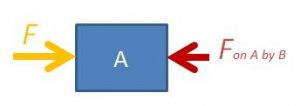
You may also consider box A on its own.

The equation is $F-F_{AB}=m_A \times a$, where $F_{AB}$ is the force exerted on box A by box B.
The third option is to consider box B on its own.

The equation is $F_{BA}=m_B \times a$, where $F_{BA}$ is the force exerted on box B by box A. Applying Newton’s 3rd law, $F_{BA}=F_{AB}$ in magnitude.
Never Draw Everything Together
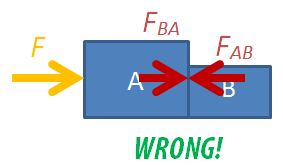
NEVER draw the free-body diagram with all the forces and moving objects in the same diagram, like this:
You will not be able to decide which forces acting on which body and much less be able to form a sensible equation of motion.
Interactive
Use the following app to observe the changes in the forces considered in the 3 different scenarios. You can vary the masses of the bodies or the external force applied.
Multiple-Body Problems
For the two-body problem above, we can consider 3 different free-body diagrams.
For three bodies in motion together, we can consider up to 6 different free-body diagrams: the 3 objects independently, 2 objects at a go, and all 3 together. Find the force between any two bodies by simplifying a 3-body diagram into 2 bodies. This trick can be applied to problems with even more bodies.
Activity 1: Propeller Cart (Predict, Observe and Explain)
Activity 2: Untied Balloon
A balloon is filled with air and released with its mouth downwards. Explain
- why it moves upwards.
- why it stops rising after some time.

