I have seen a few simulations for apparent depth but was not satisfied with them. So I created this from scratch for use in tomorrow’s lesson. The positions of the eye and image of the fish are adjustable. It is more challenging to design for the actual fish to be draggable, so I only could allow the image to be dragged and hence, use it to shift the position of the actual fish.
This applet allows for students to visualise the conditions under which a reflection can be seen in a mirror. When the mirror is too short, for instance, the point of reflection does not lie on the mirror so light cannot be reflected.
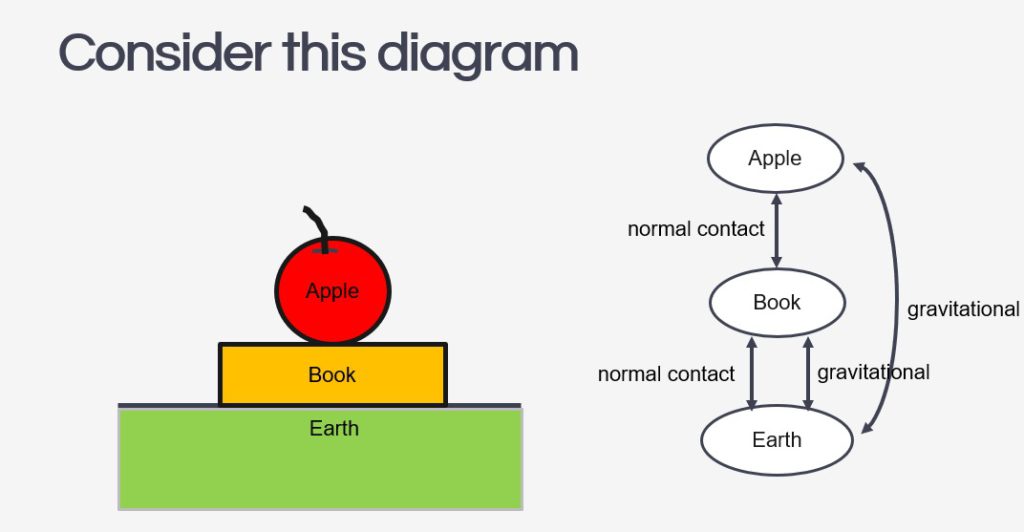
It is a common misconception for students to assume that when a book is placed on a table, its weight and the normal contact force acting on it are action-reaction pairs because they are equal in magnitude and opposite in direction.
While we can emphasise the other requirements for action-reaction pairs – that they must act on two different bodies and be of the same type of force – I have tried a different approach to prevent this misconception from taking root. After reading this article on the use of the system schema representational tool to promote understanding of Newton’s third law, I tried it out with my IP3 students.
The system schema identifies the bodies in a question and represents them with shapes detached from each other to give space to draw the connecting arrows between them. The arrows must be labelled with the type of force, either by coding them (e.g. r for reaction force, g for gravitational force) or in full.
Every force will be drawn as a double-headed arrow between two bodies to represent that they are action-reaction pairs. It is important for students to understand that every force in the universe comes in such a pair, and the system schema can help them visualise that. If there is a force without a partner, it just means the system is not in the frame yet.
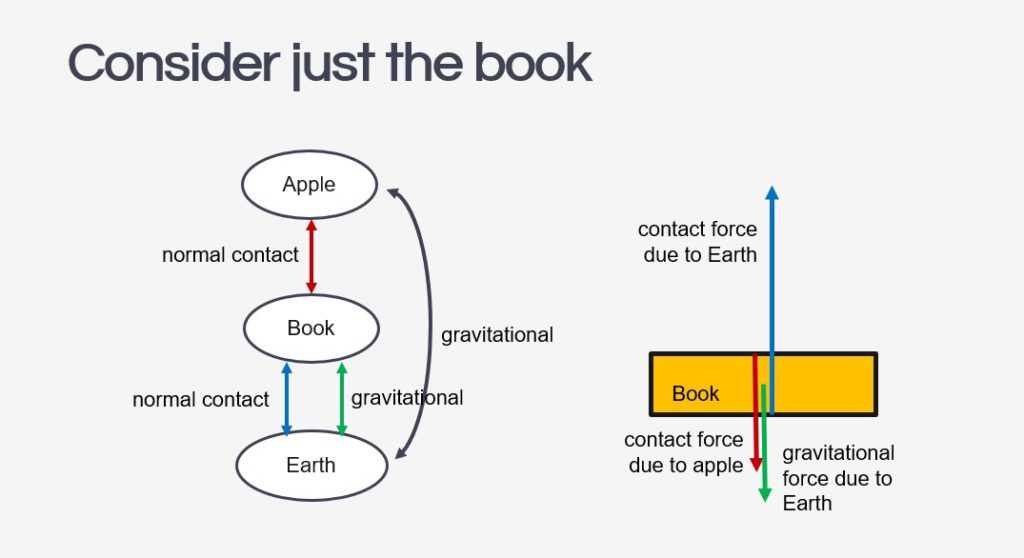
The next step to using the system schema is for students to isolate the object in question and draw its free-body diagram. Each force vector in the diagram should be accompanied by a name that includes: 1. the type of force and 2. the subject which exerts that force on the object.
The effectiveness of this method of instruction is clearly presented in the paper mentioned above, as performance on the force concept inventory’s questions on the third law saw an improved average from 2.8 ± 1.2 to 3.7 ± 0.8.
I made some refinement to an applet created last year to demonstrate how vector addition can be done either using vector triangle or parallelogram methods.
This new applet is designed for students to practise conversion of common units used in physics on their own. There is a checking algorithm within, which might need some fine-tuning. For full screen view, click here.
The worked solutions given will demonstrate the breakdown of steps that could help students learn the procedure to convert these units.