This animation is made using Geogebra. It shows the instantaneous velocity and displacement vectors of a particle undergoing simple harmonic motion while tracing its position on the velocity-displacement graph. It is meant to help student understand why the graph is an ellipse.
Try using the values in this simulation to find the velocity of this wave! Let me have your answer in the comment section!
Update on 21 August 2018: The latest iteration of this App is found here:
I am once again exploring the use of Geogebra to create simulations for Physics. This is what I managed to put together. It serves to help students visualise how a particle in a transverse wave moves. The slider allows the user to pick any particle along the horizontal direction of the wave.
Audacity is a free audio recording and editing software downloadable from http://audacity.sourceforge.net. It is cross-platform meaning you can run it on PC or Mac.
Once you have the software installed, you can try out some of its simpler functions, such as recording and playing back. You can also generate tones of known frequencies, which will be useful for experiments such as using stationary waves to determine the speed of sound in air.
Frequency and pitch
The first activity serves as an introduction to the software and can be easily carried out. All you need is a computer with Audacity installed and a microphone connected to it. Tuning forks of different frequencies will be best for this activity because of the simple and pure waveforms generated. A regular wave pattern can also be recorded with the help of a musical instrument such as a guitar or by singing a note.
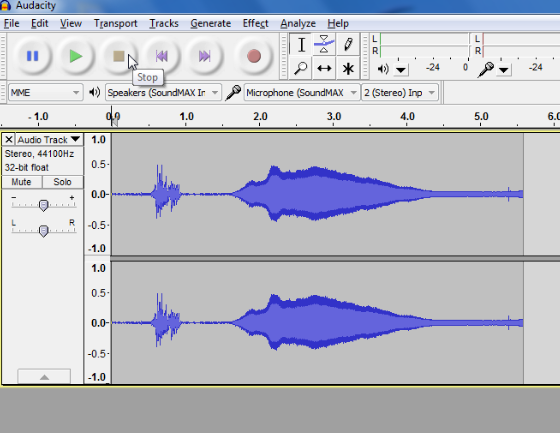
To make a sound with the tuning fork, strike it against something hard such as the heel of your hand. The two prongs of the fork, known as “tines,” will then vibrate with a fixed frequency, thus generating a waveform with a displacement that is almost sinusoidal. Place this tuning fork next to the microphone and you should see a densely packed waveform like the following:
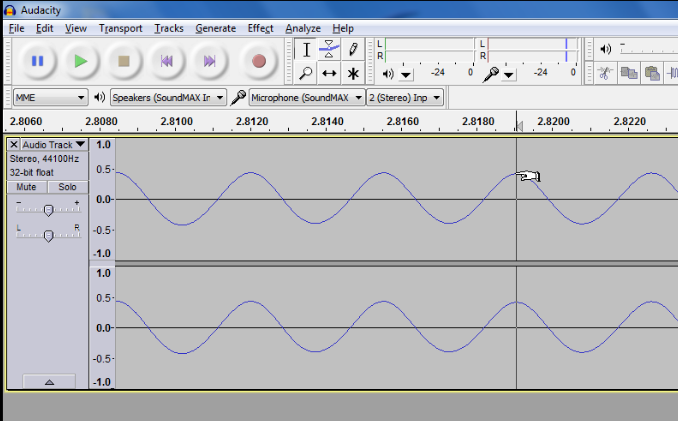
Zoom into the peaks recorded by clicking on the peaks of interest and pressing Ctrl 1 for Windows or Command 1 for Mac. You should observe a repeated pattern in the waveform.
By reading off the time difference on the horizontal axis between two peaks, you can measure the period of the wave. Using $$f=\frac{1}{T}$$ where f is the frequency of the wave, and T is the period, you can verify the frequency measured with the known value of the tuning fork’s frequency.
In the above graph, the period is 2.8190-2.8155 = 0.0035s. The frequency of the tuning fork used is given by $$f=\frac{1}{T}=\frac{1}{0.0035}= 286 \text{ Hz}$$ which is roughly that of a D note.

