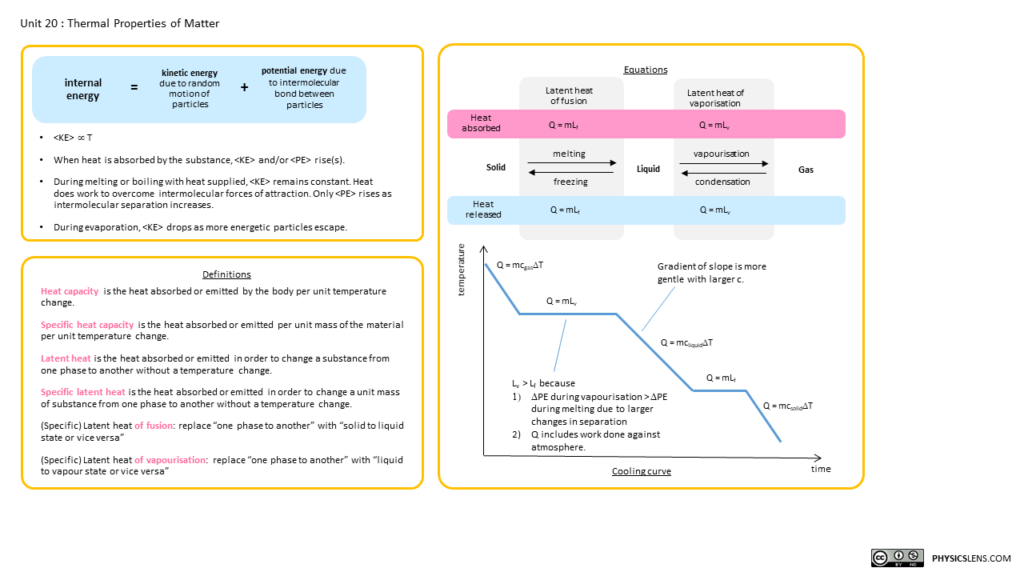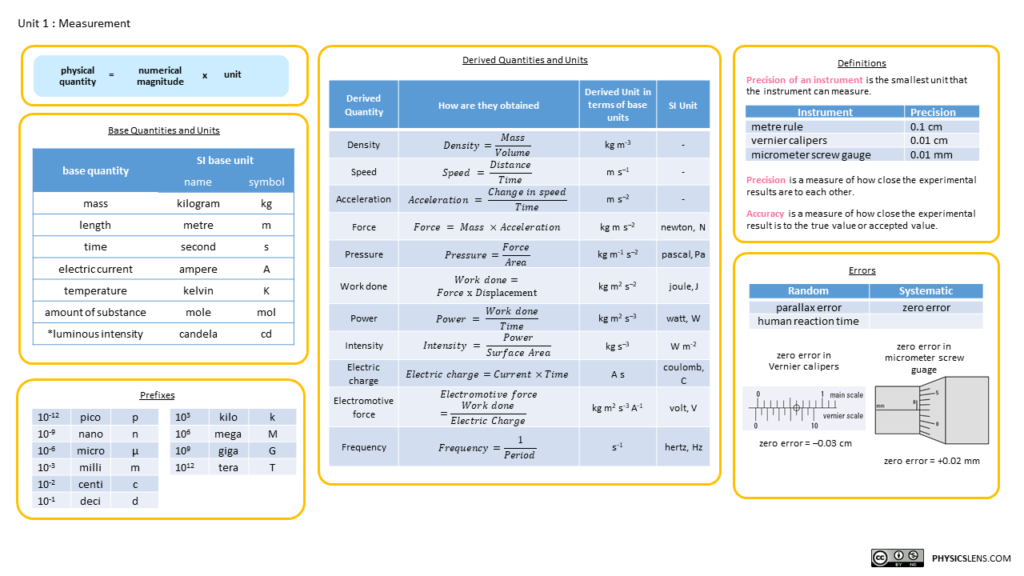
I created a set of online flashcards using Quizlet to help my students recall important terms and their meanings.
This is one of them. For the complete set for the A level syllabus, refer here.
the world in a different light
I created a set of online flashcards using Quizlet to help my students recall important terms and their meanings.
This is one of them. For the complete set for the A level syllabus, refer here.
This simple Mindmap was created using Miro, which appears to allow collaborative work, including mindmapping and project planning. Testing it out here.
Having started with making interactive simulations or visualisation apps with Easy JavaScript Simulations (EJsS) under the guidance of Senior Specialist Lawrence Wee from ETD in Nov 2016, I next learnt about GeoGebra in 2017 from my ETD colleagues who taught Math (shoutout to Loh Yan Xiang and Toh Wee Teck). I would like to share via this post a few guidelines that I have come up with when designing interactive apps for students
1. Fast and Minimalist Designs
Since picking up the necessary skills, I have been generating a number of interactives during my free time in preparation for my eventual return to teaching after my stint in ETD from Jun 2017 to Dec 2019. I continued to do so, often in tandem with the upcoming topics that I need to teach for JC1 and IP3 Physics – mainly Mechanics topics.
To balance creation of apps with fulfilling all my other duties, I needed to produce them in a minimalist and very targeted just-in-time manner. Working off templates help a lot as I do not have to redesign the buttons or re-code the animations triggered by the buttons. There is no need to spend one whole day working on an app to beautify it if all it needs to do is to demonstrate the motion of an object based on its acceleration-time graph, for instance.
2. Start with the Minimum Viable Product.
Most of the time, I need to go off to class with a minimum viable product (MVP) in software development speak – a workable no-frills version of the interactive that communicates the ideas or allows the visualisation that I intended. This will then allow me to receive quick feedback from my students on what works and what does not. I will then be able to make quick changes before the next class or in preparation for the next cycle of teaching.
3. Avoid Overloading Interactive Elements
I am a strong believer in displaying just enough buttons and sliders to do the trick. Each app should not have more than 3-4 interactive elements to avoid distracting the students from the main relationships or interactions that they need to learn.
The use of GeoGebra allows for me to make quick clones of an app and then modify it quickly to generate a new scenario, instead of adding more interactive elements to allow for multiple scenarios within a single app.
I also try to avoid giving too much information on the app itself, as I feel the content delivery should be done outside of the app, whether via the Student Learning Space, Google Classroom or even face-to-face classroom interactions.
4. Optimising for Small Screens
I try to keep to an app size of 640 px wide by 480 px height so as to optimise the app for the Student Learning Space. These dimensions also make it easy for students to view and interact with the app from their mobile phones, even when held in portrait mode.
5. Use Pastel Colours
Instead of using the traditional bold primary colours, I try to use pastel colours or more “soothing” colours to highlight key information or elements. These are the softer versions of the primary colours and I prefer to use them as it gives the key elements a pleasant accent despite the rest of the app being mainly grey, black and white.
There are two methods of calculating the energy released in a nuclear reaction, which will be demonstrated using an example. Consider the nuclear reaction:
$$^2_1H + ^3_1H \rightarrow ^4_2He + ^1_0n$$
The table below shows the values of mass and binding energy per nucleon.
binding energy per nucleon / MeV | mass / u | |
$^2_1H$ deuterium | 1.1122865 | 2.0141018 |
$^3_1H$ tritrium | 2.8272737 | 3.0160493 |
$^4_2He$ helium | 7.0739183 | 4.0026032 |
$^1_0n$ neutron | 1.0086649 |
Method 1: Calculate difference in mass $\Delta m$ and take $E = \Delta m c^2$
$\Delta m$ = 2.0141018 + 3.0160493 – 4.0026032 – 1.0086649 = 0.0188830 u
$E = \Delta m c^2$
= 0.0188830 × 1.66054 × 10-27 kg × (2.99792 × 108 m s-1)2
= 2.8181 × 10¹² J
= 17.589 MeV
Method 2: Calculate difference in binding energy
Changing in B.E. = B.E. of $^4_2He$ – (B.E. of $^2_1H$ + B.E. of $^3_1H$)
= 4(7.0739183) MeV – [2(1.1122865) + 3(2.8272737)] MeV
= 17.589 MeV
The following GeoGebra interactives demonstrate the first few harmonics of an open pipe and a closed pipe given a fixed velocity of sound (340m/s). The frequencies and wavelengths are auto-calculated. Length of the pipe can be varied. Feel free to use, copy or edit them.
Open Pipe
Source: https://www.geogebra.org/m/tsufws72
For embedding into SLS or other websites:
<iframe scrolling="no" title="Harmonics of Open Pipes" src="https://www.geogebra.org/material/iframe/id/tmeypwgx/width/700/height/500/border/888888/sfsb/true/smb/false/stb/false/stbh/false/ai/false/asb/false/sri/false/rc/false/ld/false/sdz/false/ctl/false" width="700px" height="500px" style="border:0px;"> </iframe>
Closed Pipe
Source: https://www.geogebra.org/m/m3p7hny5
For embedding into SLS or other websites:
<iframe scrolling="no" title="Harmonics for Closed Pipe" src="https://www.geogebra.org/material/iframe/id/gm9k6hkg/width/700/height/500/border/888888/sfsb/true/smb/false/stb/false/stbh/false/ai/false/asb/false/sri/false/rc/false/ld/false/sdz/false/ctl/false" width="700px" height="500px" style="border:0px;"> </iframe>
This GeoGebra interactive allows students to vary the position of the centre of gravity of a shelf in order to observe the changes of the other two force vectors. The position of the supporting cable can be adjusted too.
The ability to resolve vectors allows students to apply principle of moments to understand how the vertical components of each force vary.
This is meant for the JC1 topic of Forces.
To embed into SLS, you can use the following code:
<iframe scrolling="no" title="Equilibrium of a Wall Shelf" src="https://www.geogebra.org/material/iframe/id/xdbr7qr5/width/700/height/500/border/888888/sfsb/true/smb/false/stb/false/stbh/false/ai/false/asb/false/sri/false/rc/false/ld/false/sdz/false/ctl/false" width="700px" height="500px" style="border:0px;"> </iframe>