10 February
This is a post that exists simply to park the YouTube videos that I might need to use during a JC2 lecture on Electromagnetism.
the world in a different light
This is a post that exists simply to park the YouTube videos that I might need to use during a JC2 lecture on Electromagnetism.
As a means of visualising what happens to the potential difference, current and power dissipated in an alternating current circuit with half-wave rectification, I have created the interactive applet with all 3 graphs next to each other.
It should be easy for students to see that with half-wave rectification, the power dissipated is half that of a normal a.c. supply with the same peak p.d. and current.
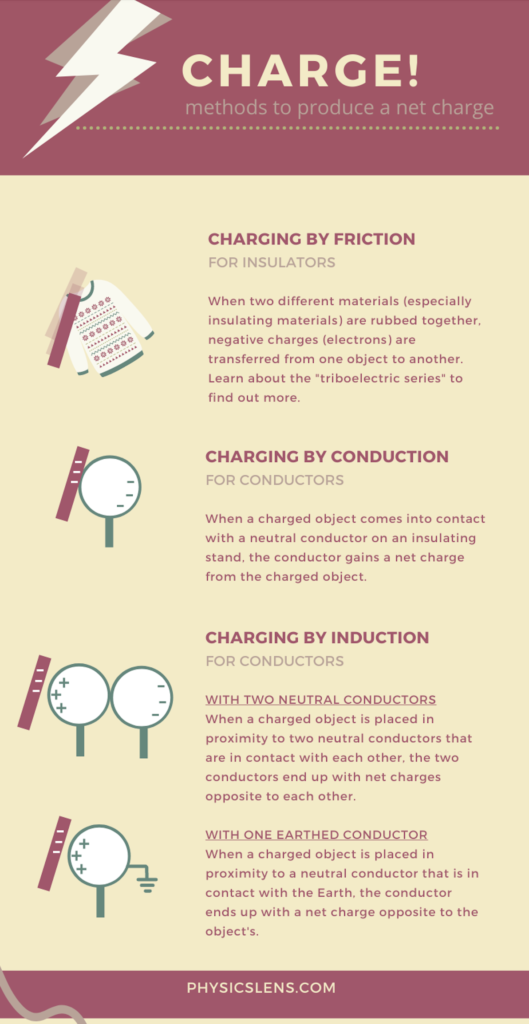
This is another Infographic made using Canva last year.
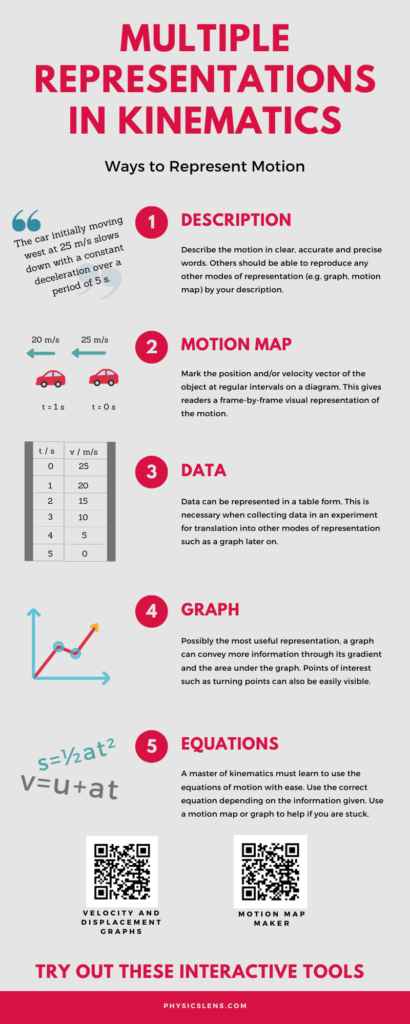
I like Canva for its ease of use and beautiful templates for creating simple infographics. This is an example of one that I did to simplify the content for IP4 Static Electricity.
My ex-colleague Lawrence did a simplified simulation on how vaccination can work to slow down the spread of Covid-19. It shows a clear correlation between rate of transmission and percentage vaccinated. Of course, experts recommend 80% vaccination rate but every bit counts as you can see from the simulation. I will be sure to receive mine when we get our turn.
It could also be useful for educating the public on the continued need for social distancing/masks despite having a sizeable population being vaccinated.
(Note: p = probability of spread upon contact, and you can use the dropdown menu to select different modes of safe management measures)In preparing for blended learning lessons for my JC2 students, I tweaked the Gravitational Potential applet made last year for a similar display of the electric potential between two point charges. This is a testament to the similarities between the two concepts as well as the ease of adapting a GeoGebra applet for education.
We can scaffold students’ learning using this interactive applet by asking questions such as:
To paste this applet into SLS, use the following embed code. In SLS, create a new component within an Activity within a Lesson using the “+” button. Choose Text/Media and select the button that shows “</>” or reads Embed Website/App”. Copy and paste the following codes to the box.
<iframe scrolling="no" title="Electric Potential of Two Point Charges" src="https://www.geogebra.org/material/iframe/id/z8cr66wb/width/640/height/480/border/888888/sfsb/true/smb/false/stb/false/stbh/false/ai/false/asb/false/sri/false/rc/false/ld/false/sdz/true/ctl/false" width="640px" height="480px" style="border:0px;"> </iframe>By embedding the gravitational potential distance graph for two masses, a comparison can be made between the two. This will help students draw connections between the two concepts based on the fact that the forces both follow an inverse-square law.
This is the embed code for the applet on gravitational potential.<iframe scrolling="no" title="Gravitational Potential between Two Planets" src="https://www.geogebra.org/material/iframe/id/ff55x6vr/width/638/height/478/border/888888/sfsb/true/smb/false/stb/false/stbh/false/ai/false/asb/false/sri/true/rc/false/ld/false/sdz/false/ctl/false" width="638px" height="478px" style="border:0px;"> </iframe>