Trial of AI Feedback Assistant in SLS for Physics

The Singapore Student Learning Space introduced a Short-Answer Feedback Assistant recently and this is my first attempt at testing it out with a simulated student account. The purpose of the Feedback Assistant is to provide auto-generated constructive feedback on short-form written responses based on a set of answers provided by the setter. The system works on natural language processing (NLP) algorithms that analyze the structure, semantics, and context of the mark-scheme and user response to understand the meaning behind the user’s response. It then generates feedback based on the analysis. I am still in the process figuring out how the mark-scheme should be written to help the AI give the most accurate response.

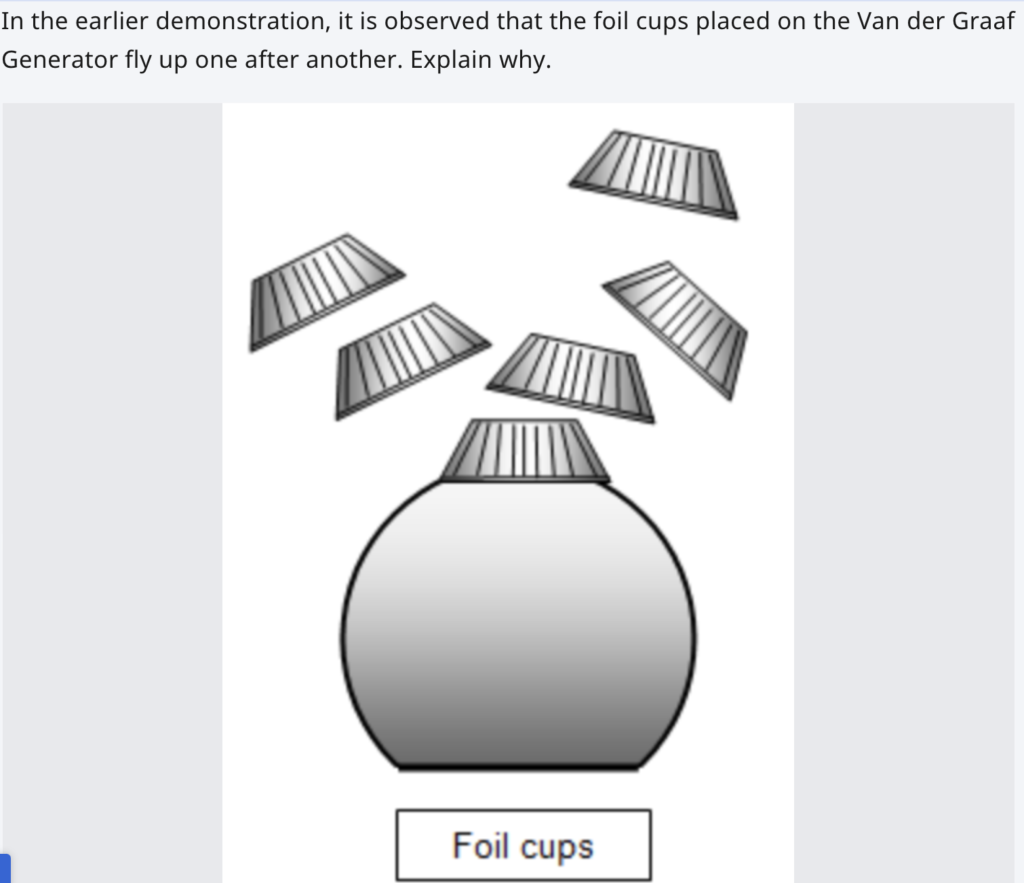
As a testing question, I used the following:

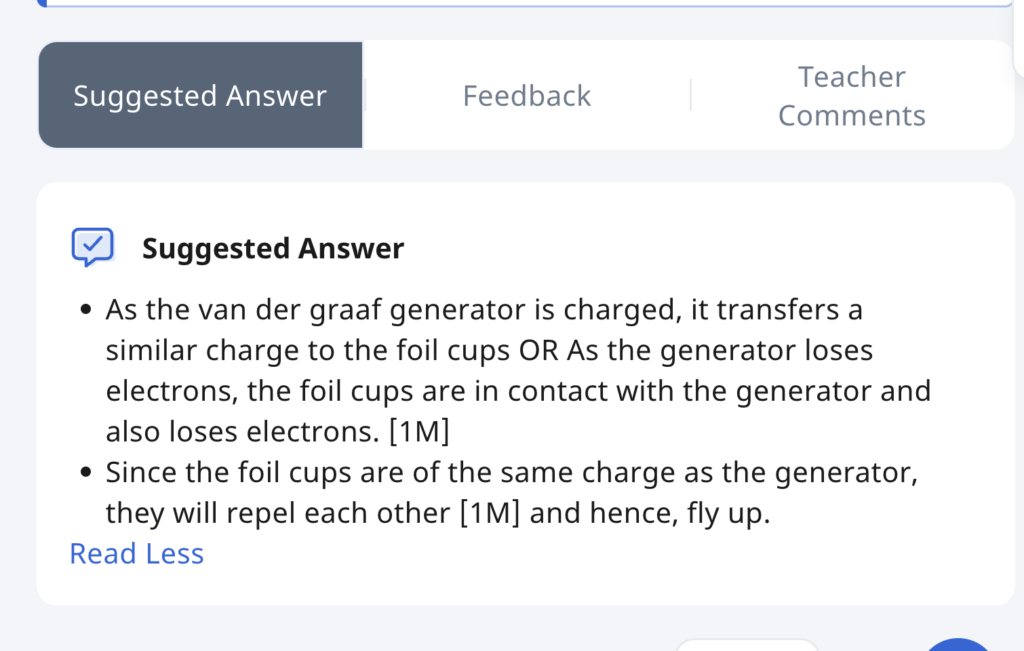
The mark scheme was written in point form for easy reading and the mark to be awarded for each point written in square brackets.

The student response was as follow:

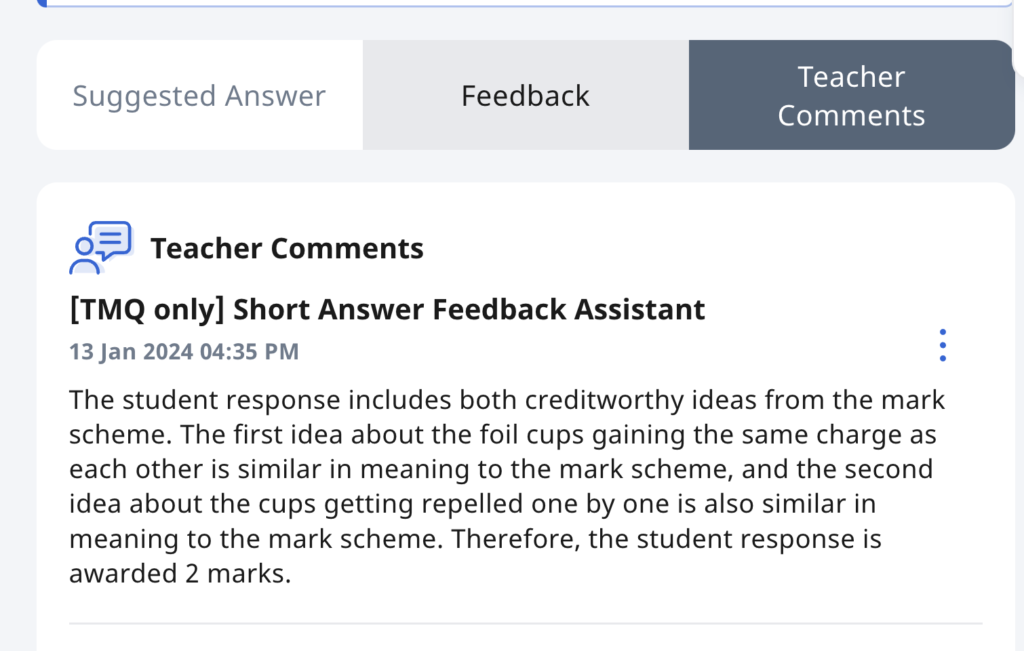
The feedback assistant then graded and proposed a feedback to the student which is found here. The NLP engine seems to be working well with the format of the mark scheme given (in point form and with marks indicated in brackets). I am still going to experiment with more questions but the results look promising for now.

However, the teacher will still likely have to keep an eye on the responses and edit it for a more accurate feedback. Unfortunately, I am not teaching for the next few months as I am on a course and will not be able to test this out with actual students but I look forward to doing so.

I also wonder if the auto-generated comments could also be trained to provide suggestions on follow-up learning activities.

Testing out Microsoft Bing Image Creator for drawing diagrams for exam papers

I was wondering if we could use generative AI to simplify the diagram drawing process while setting exam questions. Then I came across Microsoft’s Bing Image Creator, which is powered by Dall.E 3, which is in turn, built on ChatGPT. After signing up for an account, I was given 100 free credits to test it out.

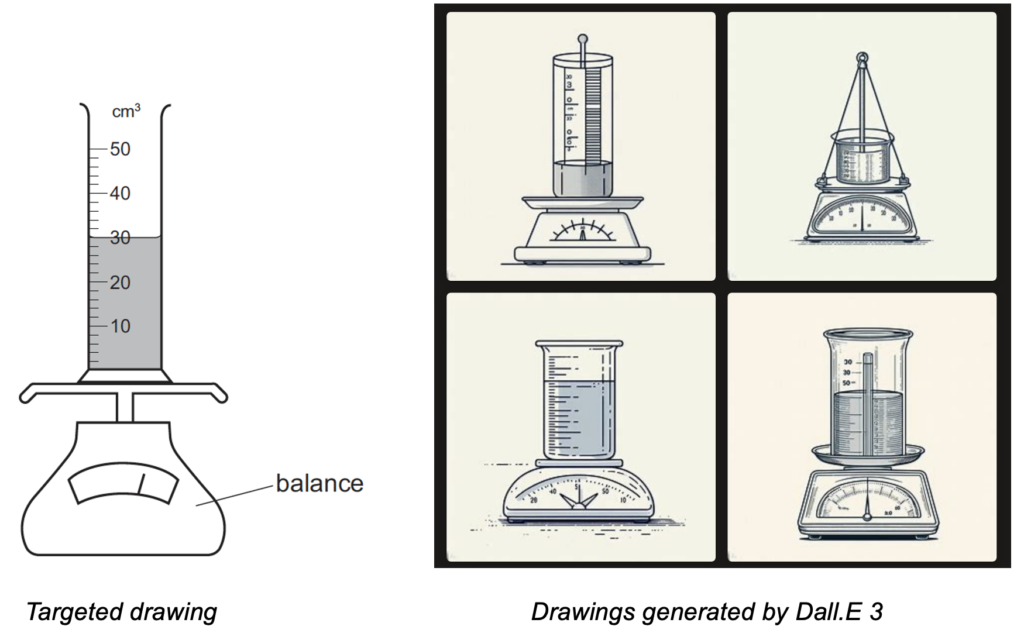
I used the diagram on the left as a target and the diagram on the right was generated using the following prompt:

A minimalist line drawn diagram with clean lines of about 1 mm thick, in the style of the exam papers. Show a measuring cylinder with markings up to 50 cm^3 containing 30 cm^3 of a liquid that is grey in colour. The measuring cylinder is on a weighing balance with a curved display for the analogue scale. A needle points slightly to the right within that scale.

This was a decent output. I could give the diagrams on the top left or bottom left boxes a little touchup and they will be good for use in a test paper.

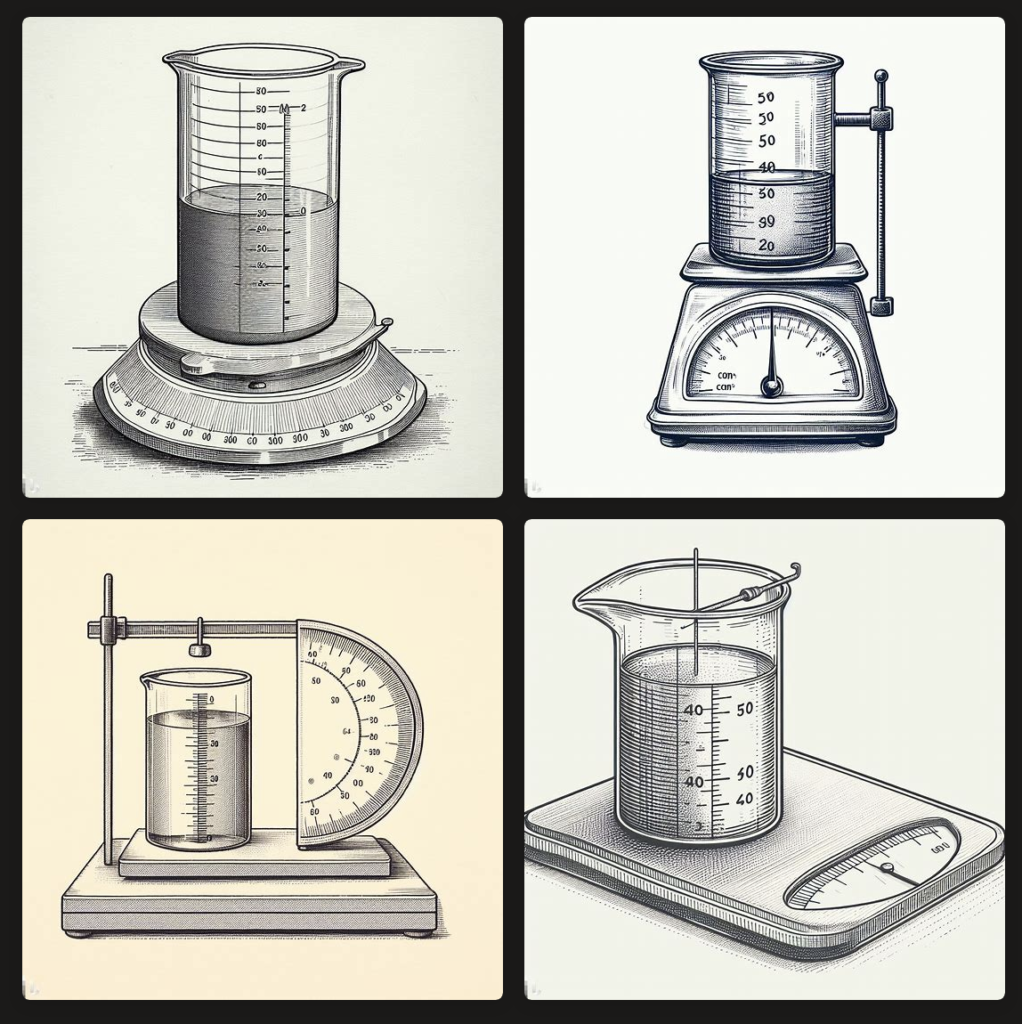
In fact, the attempt above was the second one. The first attempt got me this set of pictures, which were more 3-dimensional and had more unwanted components such as retort stands and a protractor.

The prompt used was this:

A line drawn diagram with lines of about 1 mm thick, in the style of the Cambridge Physics exam papers. Show a measuring cylinder with markings up to 50 cm^3 containing 30 cm^3 of a liquid that is grey in colour. The measuring cylinder is on a weighing balance with a curved display for the analogue scale. A needle points slightly to the right within that scale.

While I could further refine the diagram to make it as close to the desired picture as possible, I did not want to waste anymore free credits. I feel that, with a monthly subscription fee of USD20, it will be worth it only if I use Dall.E on a daily basis, which is unlikely. However, for content creators such as textbook writers or curriculum resource developers, this might be of use.

Crafting the right prompts for the image creator takes skill. Being specific is key to obtaining the image that you have in mind. I first tested it out using a prompt that was too brief:

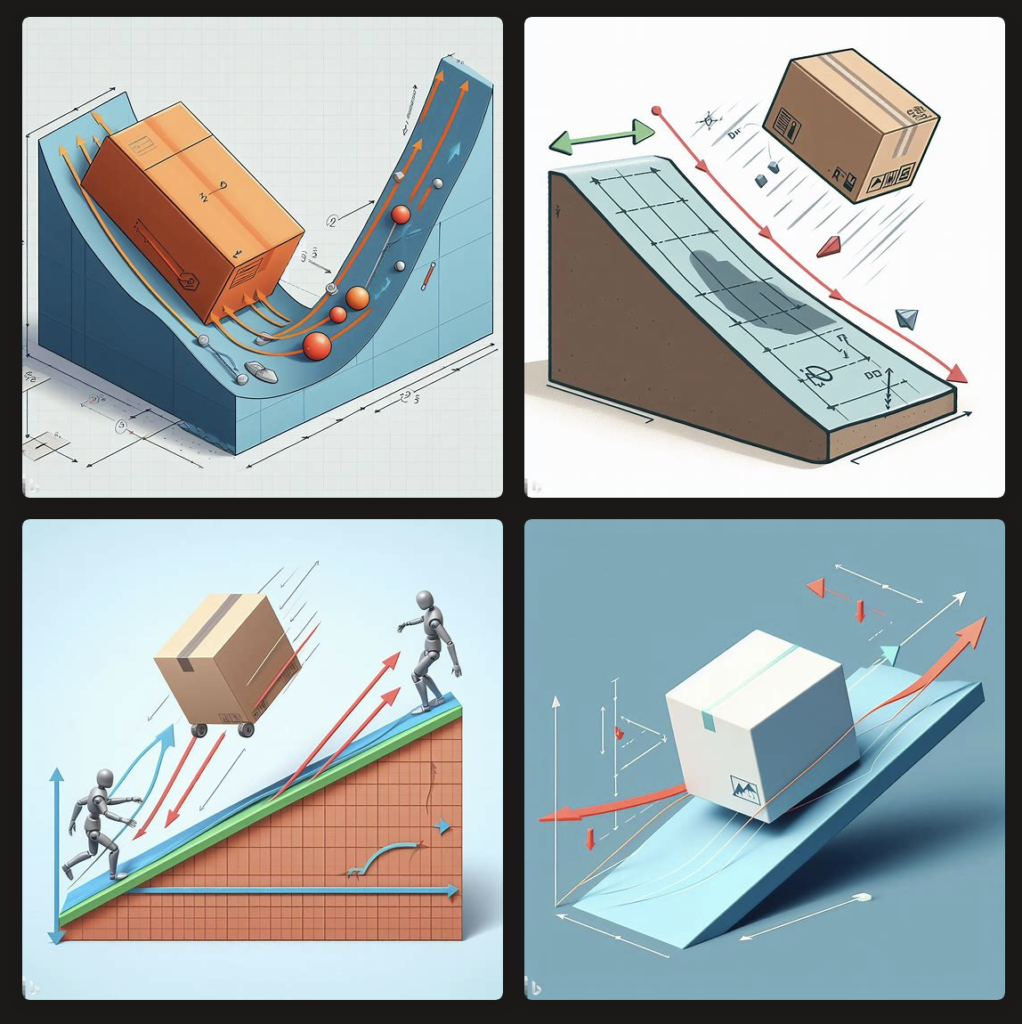
free body diagram with real life object and physical 3D vector arrows showing a box sliding down a rough slope

This was the disastrous outcome:

Do let me know if you are also trying ways to use AI to make the exam-setting process more efficient and share your tips!

Simulation of a Bouncing Ball

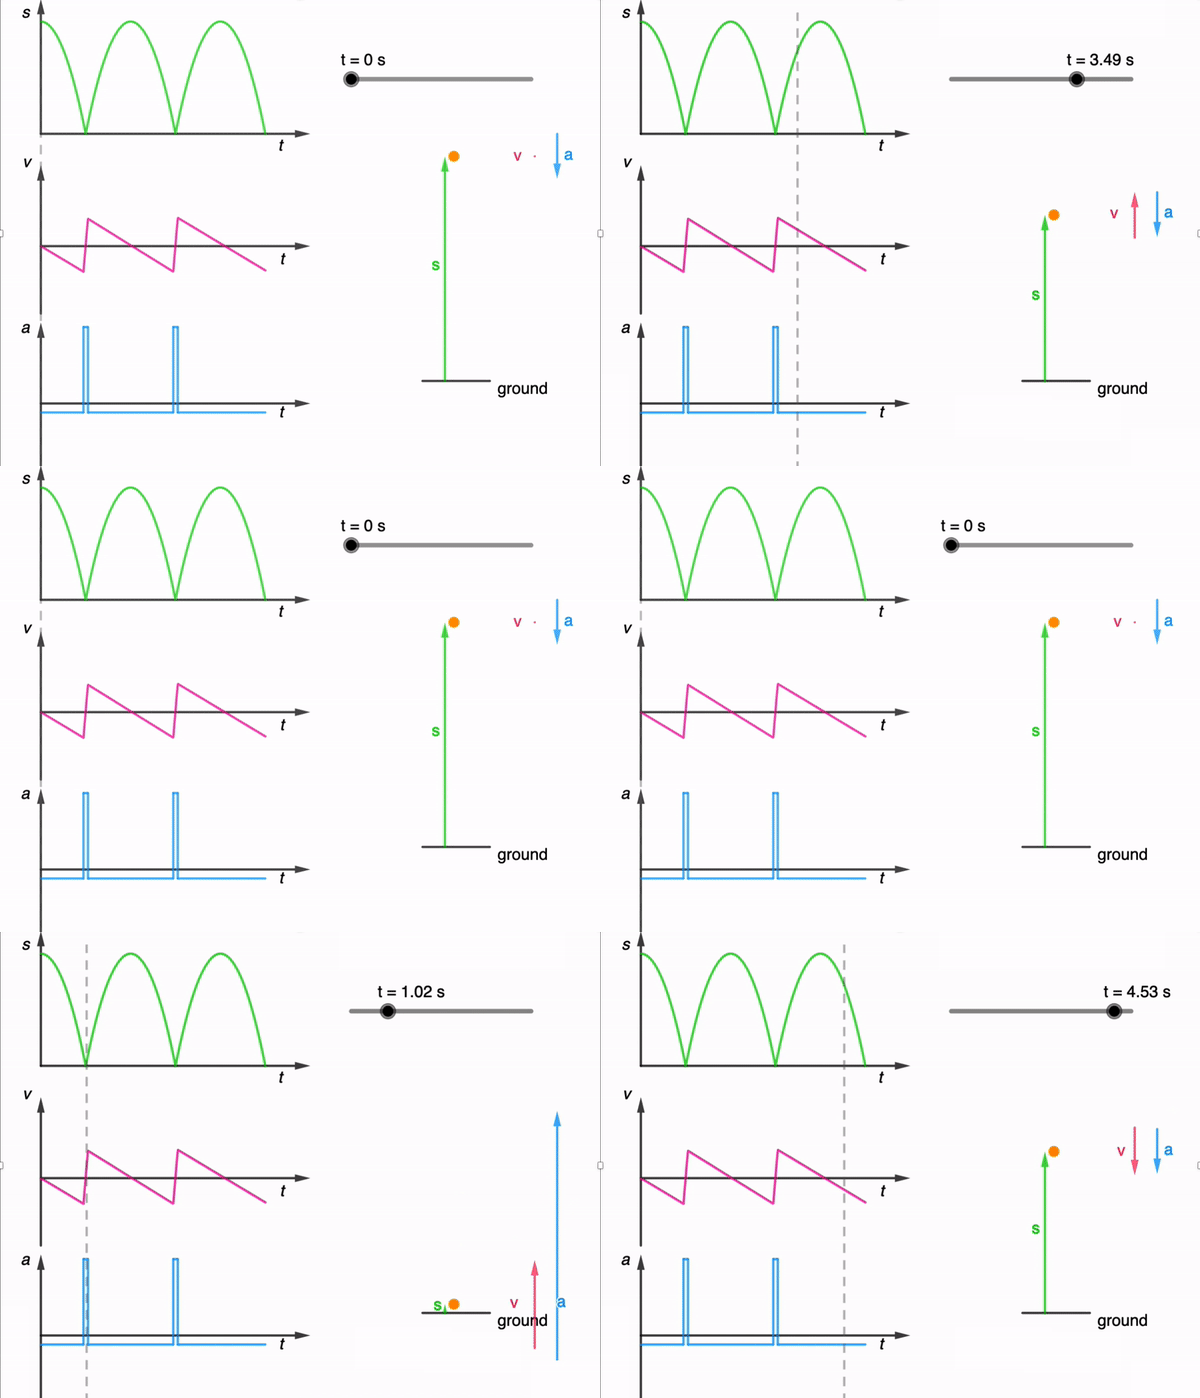
While I have shared a simulation of a bouncing ball made using Glowscript before, I felt that one made using GeoGebra is necessary for a more comprehensive library.

It took a while due to the need to adjust the equations used based on the position of the graphs, but here it is: https://www.geogebra.org/m/dfb53dps

The kinematics of a bouncing ball can be explained by considering the dynamics and forces involved in its motion. In this simulation, air resistance is assumed negligible. When a ball is dropped from a certain height and bounces off the ground, several key principles of physics come into play. Let’s break down the process step by step:

Free Fall: When the ball is released, it enters a state of free fall. During free fall, the only force acting on the ball is gravity. This force is directed downward and can be described by W = mg

W is the gravitational force.
m is the mass of the ball.
g is the acceleration due to gravity (approximately 9.81 m/s² near the surface of the Earth).

Impact with the Ground and Bounce: When the ball reaches the ground, it experiences a force due to the collision with the surface. This force is an example of a contact force and much larger than the gravitational force. This force depends on the elasticity of the ball and the surface it bounces off.

During the collision with the ground, the ball’s momentum changes rapidly. If the ball and the ground are both ideal elastic materials, the ball will bounce back with the same speed it had just before impact. In reality, some energy is lost during the collision, causing the bounce to be less than perfectly elastic. This simulation assumes elastic collisions.

Post-Bounce Motion: After the bounce, the ball starts moving upward. Gravity acts on it as it ascends, decelerating its motion until it reaches its peak height.

Second Descent: The ball then starts descending again, experiencing the force of gravity pulling it back down towards the ground.

This process continues with each bounce. In practice, with each bounce, some energy is lost due to the non-ideal nature of the collision and other dissipative forces like air resistance. As a result, each bounce is typically lower than the previous one until the ball eventually comes to rest. However, for simplicity, the simulation assumes no energy is lost during the collision and to dissipative forces.

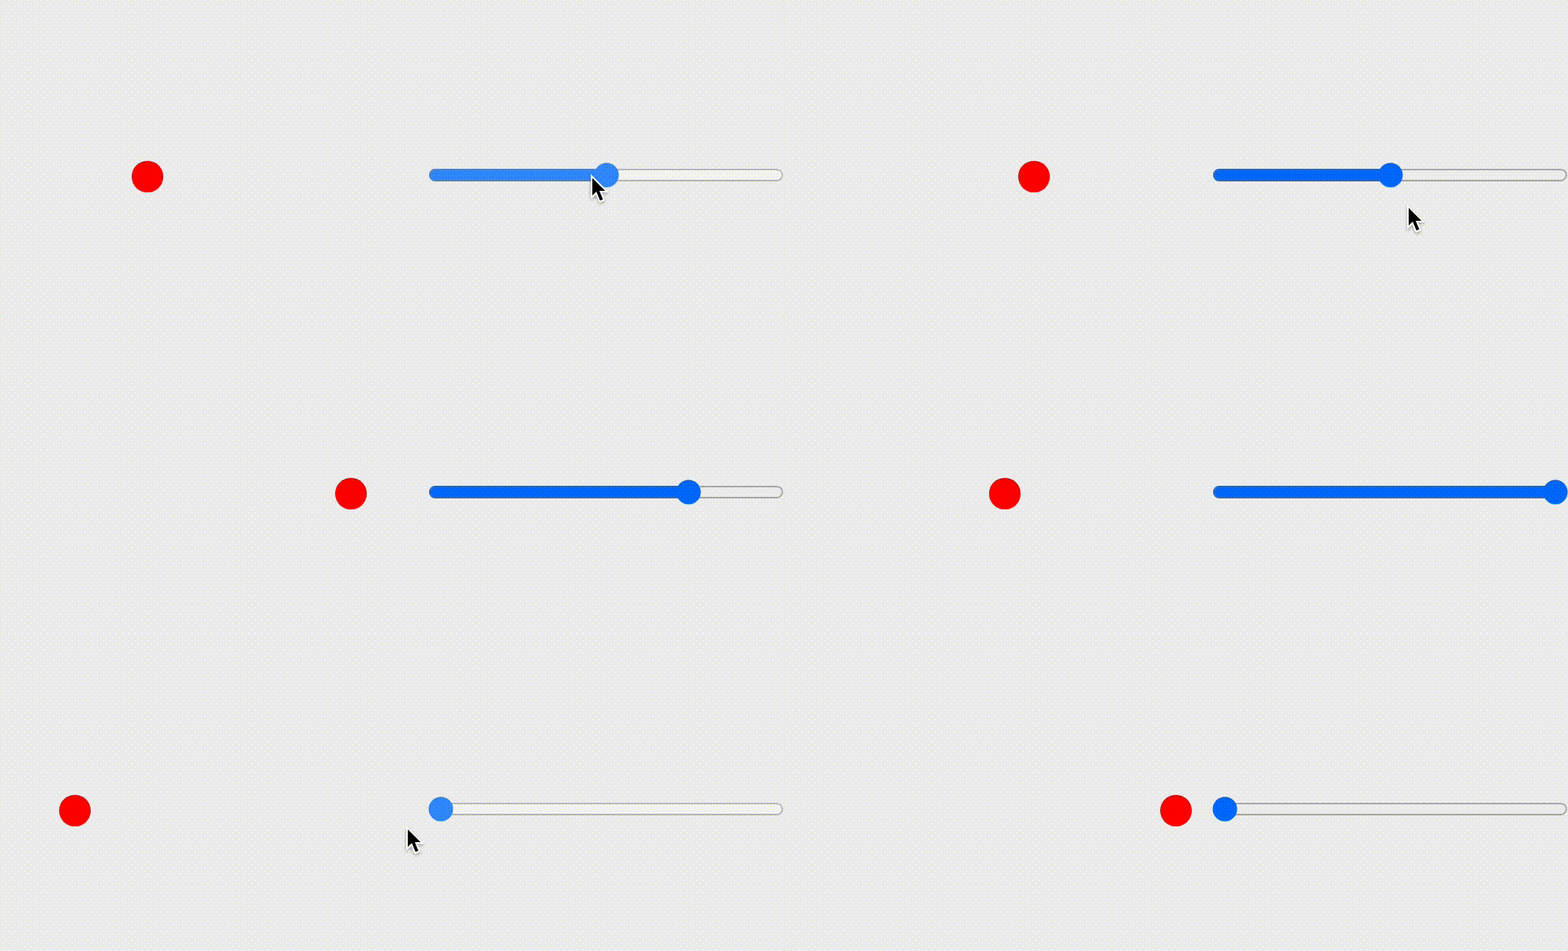
An animated gif file is included here for use in powerpoint slides:

LOL Diagram Template using GeoGebra

Direct link: https://www.geogebra.org/m/u2m3gnzj

The above is a GeoGebra applet that can be customised for any energy problem. Simply make a copy of it and change the values or labels as needed. This can be integrated into either GeoGebra Classroom or Google Classroom (as a GeoGebra assignment) and the teacher can then monitor every student’s attempt at interpreting the energy changes in the problem. The teacher can also choose different extents of scaffolding, e.g. provide the initial or final states and ask students to fill in the rest.

What is an LOL Diagram?

An LOL diagram is a tool used to visualize and analyze the conservation of energy in physical systems. “LOL” does not stand for anything meaningful. Rather, they just form the shapes of the two sets of axes and the circle in between. They help clarify which objects or components are included in the energy system being considered and how energy is transferred or transformed within that system.

In LOL diagrams:

  • An energy system is defined as an object or a collection of objects whose energies are being tracked.
  • LOL diagrams consist of three parts: a L-shaped bar-chart representing the initial state, an O representing the object (or system) of interest and another L-shaped bar-chart representing the final state.
  • There can also be energy transferred into the system or out of the system if the system is not closed or isolated. These are represented using horizontal bars below the L axes, with arrows indicating if they are energy transferred in or out.

When performing calculations involving the initial and final energy states, the energy transferred into the system is added to the initial energy state while the energy transferred out of the system is added to the final energy state. The sums must be equal. In other words,

Initial energy stores + Energy transferred into system = Final energy stores + Energy transferred out of system

How do I use an LOL diagram?

Here’s a breakdown of how LOL diagrams are used, using an example of a falling mass:

  1. System Definition (O):
    • Choose what is part of the energy system (objects whose energies are being tracked) and what isn’t.
    • For example, in the case of a falling mass, the mass itself and the Earth are part of the energy system.
  2. Initial State (L):
    • Represent the initial energy configuration of the system.
    • Identify the types of energy present in the system at the beginning. In this example, we begin with some gravitational potential energy.
  3. Transition:
    • Show how energy changes as the system evolves. In the falling mass example, the gravitational potential energy decreases, and kinetic energy increases.
  4. Final State (L):
    • Represent the energy distribution in the system at the end of the process.
    • In the falling mass example, at the point just before it hits the ground, kinetic energy is maximized, and gravitational potential energy is minimized.

LOL diagrams illustrate that energy within the system is conserved, meaning the total energy in the system remains constant.

External work (work done by forces outside the defined system) may impact the system’s energy, but internal work (work done within the defined system) does not change the total energy of the system.

The mathematical representation of the above problem will then simply be:

GPE = KE

$mgh = \dfrac{1}{2}mv^2$

This problem seems a bit trivial. Since LOL diagrams are a visual tool to help students and scientists analyze energy transformations and conservation, they can be used for making it easier to set up and solve conservation of energy equations in problems of greater complexity.

LOL Diagram of an Electrical Circuit

It is also important to note that the choice of the object (or system) of interest will result in different LOL diagrams for the same phenomenon.

For example, consider a filament bulb in a circuit with a battery. The system at room temperature also has some energy in the internal store (or internal energy, which consists of the kinetic and potential energies of the particles in the system).

When considering the filament as the object of interest, when energy is transferred electrically from the battery, part of it is transferred by light from the bulb to the surroundings and another part is added to the internal store, as it heats up the filament light.

On the other hand, when considering the circuit as the whole, the chemical potential store of the battery is included in the initial energy state of the system. Hence, there is no additional energy transfer into the system but the energy transfer output is still the same.

How do I modify the GeoGebra applet to make my own LOL Diagram?

Here’s a video that demonstrates how the editing process is done, in a little more than one minute!

The final product is here.

Snell’s Law Self-Assessment

My third applet today is a self-assessment tool for students to practise calculations with Snell’s Law, i.e. $n_1 \sin{\theta_1} = n_2 \sin{\theta_2}$.

The direct link to the applet is https://www.geogebra.org/m/fhmmuhbg

Snell’s law, also known as the law of refraction, describes how light waves change direction as they pass from one medium to another with different refractive indices. It states that the ratio of the sine of the angle of incidence to the sine of the angle of refraction is constant for a given pair of media. This law is fundamental in understanding the bending of light when it moves between materials of different optical densities, such as when light passes from air to water, resulting in phenomena like the bending of a pencil in a glass of water.

When light travels from a medium with higher optical density to a medium with lower optical density,

  1. The light ray bends away from the normal: The “normal” is an imaginary line perpendicular to the interface (boundary) between the two media. As light enters the medium with lower optical density, it slows down, causing it to bend away from the normal.
  2. The angle of refraction is larger than the angle of incidence: The angle of incidence is the angle between the incident ray and the normal, while the angle of refraction is the angle between the refracted ray and the normal. In this scenario, the angle of refraction will be larger than the angle of incidence.

When light travels from a medium with lower optical density to a medium with higher optical density,

  1. The light ray bends towards the normal: As the light enters the medium with higher optical density, it slows down, causing it to bend towards the normal, which is an imaginary line perpendicular to the interface (boundary) between the two media.
  2. The angle of refraction is smaller than the angle of incidence: The angle of incidence is the angle between the incident ray and the normal, while the angle of refraction is the angle between the refracted ray and the normal. In this situation, the angle of refraction will be smaller than the angle of incidence.

When light travels from a medium with a higher refractive index to a medium with a lower refractive index and strikes the interface at an angle of incidence greater than the critical angle, total internal reflection occurs. At this critical angle, the light is entirely reflected back into the higher refractive index medium, with no refraction into the second medium, resulting in the complete internal reflection of the light. This phenomenon is crucial in various applications, such as optical fiber communications and the brilliance of gemstones like diamonds.

Update on 27 Jul 2023: I improved on the rather unpolished applet to adjust the calculations for the object when it is below the boundary between the two media. Also added was an indication for when total internal reflection takes place.