There is a new internet trend called “tensegrity” – an amalgamation of the words tension and integrity. It is basically a trend of videos showing how objects appear to float above a structure while experiencing tensions that appear to pull parts of the floating object downwards.
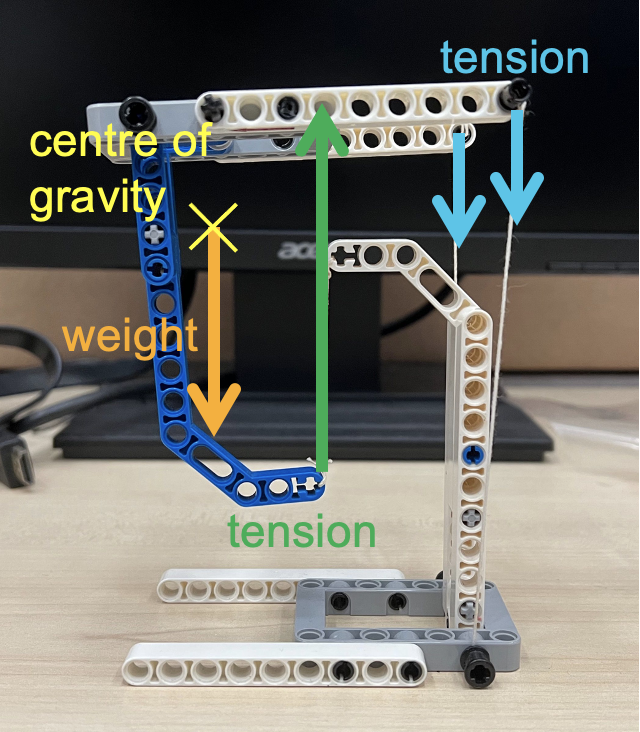
In the diagram below, the red vectors show the tensions acting on the “floating” object while the green vector shows the weight of the object.
The main force that makes this possible is the upward tension (shown below) exerted by the string from which the lowest point of the object is suspended. The other tensions are downward and serve to balance the moment created by the weight of the object. The centre of gravity of the “floating” structure lies just in front of the supporting string. The two smaller downward vectors at the back due to the strings balance the moment due to the weight, and give the structure stability sideways.
This is a fun demonstration to teach the principle of moments, and concepts of equilibrium.

The next image labels the forces acting on the upper structure. Notice that the centre of gravity lies somewhere in empty space due to its shape.
These tensegrity structures are very easy to build if you understand the physics behind them. Some tips on building such structures:
- Make the two strings exerting the downward tensions are easy to adjust by using technic pins to stick them into bricks with holes. You can simply pull to release more string in order to achieve the right balance.
- The two strings should be sufficiently far apart to prevent the floating structure from tilting too easily to the side.
- The centre of gravity of the floating structure must be in front of the string exerting the upward tension.
- The base must be wide enough to provide some stability so that the whole structure does not topple.
Here’s another tensegrity structure that I built: this time, with a Lego construction theme.

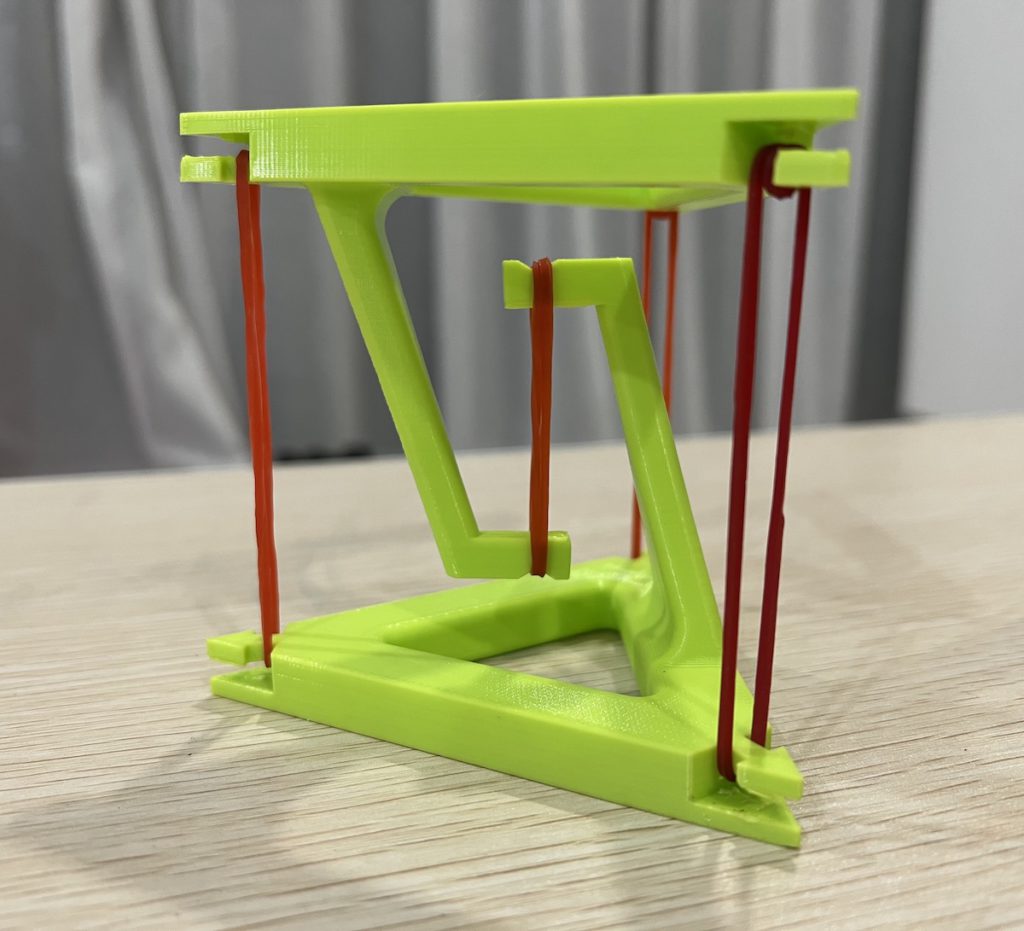
Apart from using Lego, I have also 3D-printed a tensegrity structure that only requires rubber bands to hold up. In this case, the centre of gravity of the upper structure is somewhere more central with respect to the base structure. Hence, 3 rubber bands of almost equal tension will be used to provide the balance. The STL file for the 3D model can be downloaded from Thingiverse.com.
The main challenge in assembling a tensegrity structure is the adjustment of the tensions such that the upper structure is balanced. One way to simplify that, for beginners, is to use one that is supported by rubber bands as the rubber bands can adjust their lengths according to the tensions required.
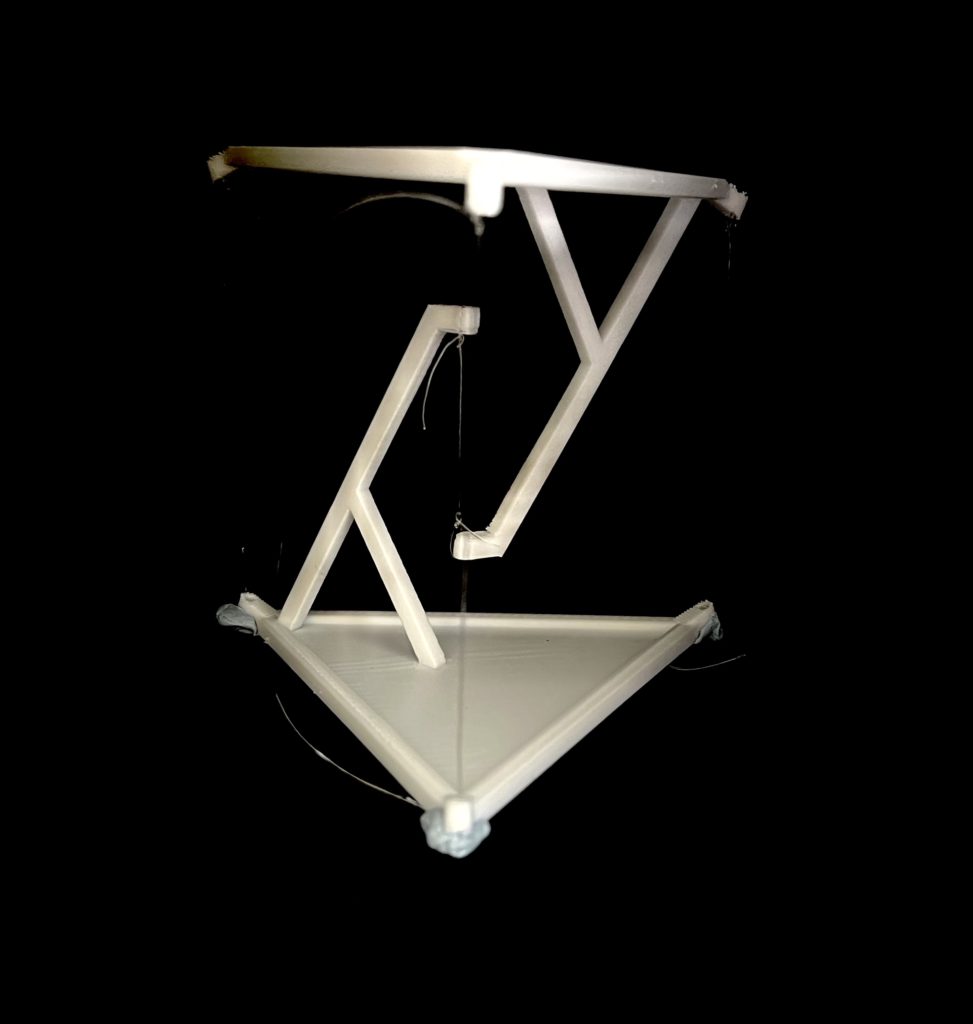
Another tip is to use some blu-tack instead of tying the knots dead such as in the photo below. This is a 3D printed structure, also from Thingiverse.
(This post was first published on 18 April 2020 and is revised on 24 August 2022.)